
Condo Sales Down in October in Waterloo Region
I hope you are having a wonderful weekend. Looks like we have snow in the region today but hopefully it doesn’t stay too long. I am sure we will be hearing Christmas music on the radio soon enough.
The Real estate market stats are out for October and things seem to have taken a bump up in the first 2 weeks of October but that was short lived with the market slowing down again near the end of the month. Let’s take a look at the breakdowns.
There were 569 homes sold last month. This represents a 6.7 per cent decrease compared to the same period last year and a decline of 18.4 per cent compared to the average number of homes sold in the previous ten years for the same month.
While October home sales in Waterloo Region lag behind historical averages, activity did pick up compared to September. With more listings available than we typically see this time of year and borrowing costs beginning to ease, buyers have the opportunity to explore a wider range of options.
Total residential sales in October included 371 detached homes (down 3.4 per cent from October 2024), and 89 townhouses (down 16.8 per cent). Sales also included 56 condominium units (down 16.4 per cent) and 49 semi-detached homes (down 2.0 per cent).
In October, the average sale price for all residential properties in Waterloo Region was $734,928. This represents a 5.6 per cent decrease compared to October 2024 and a 2.4 per cent decrease compared to September 2025.
- The average sale price of a detached home was $842,907. This represents a 4.8 per cent decrease from October 2024 and a decrease of 1.6 per cent compared to September 2025.
- The average sale price for a townhouse was $593,652. This represents an 8.2 per cent decrease from October 2024 and a decrease of 2.2 per cent compared to September 2025.
- The average sale price for an apartment-style condominium was $433,746. This represents a 10.2 per cent decrease from October 2024 and a decrease of 1.9 per cent compared to September 2025.
- The average sale price for a semi was $573,332. This represents a decrease of 11.9 per cent compared to October 2024 and a decrease of 7.7 per cent compared to September 2025.

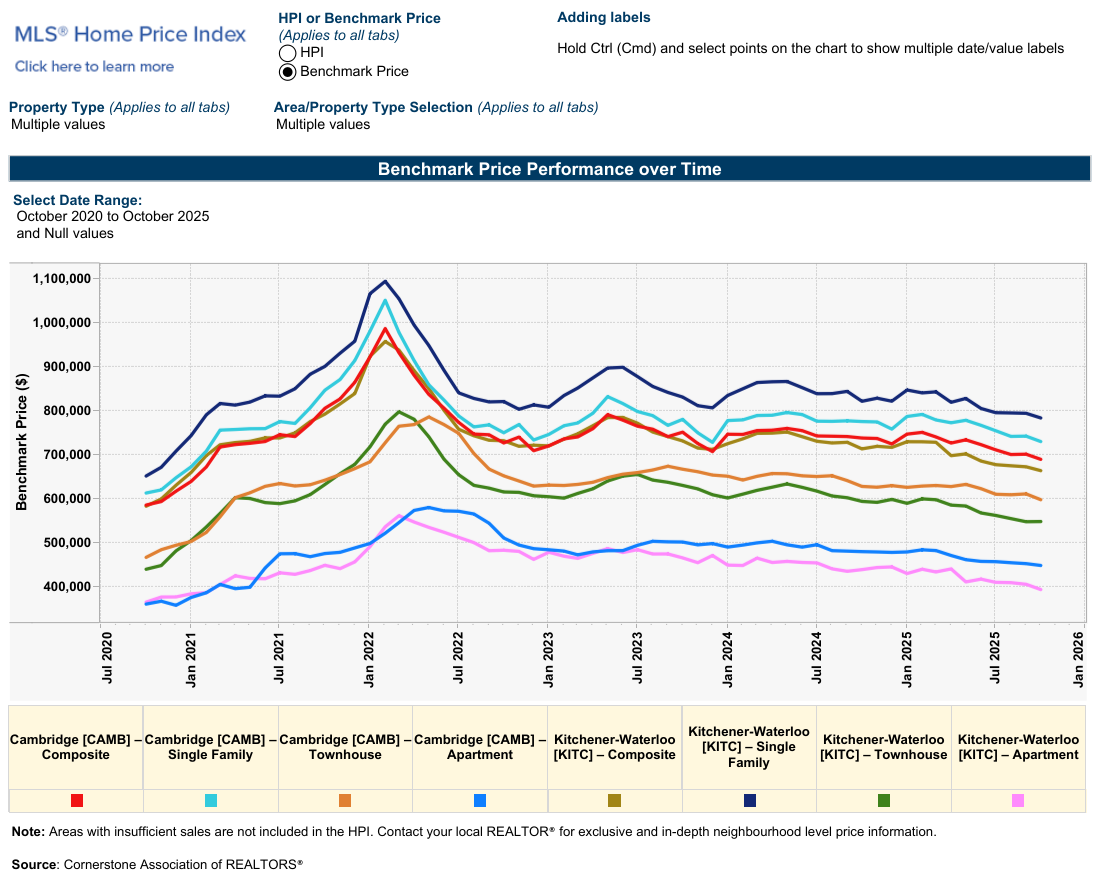
| MLS® Home Price Index Benchmark Price (HPI) | ||||||
| Kitchener-Waterloo | Cambridge | |||||
| Benchmark Type: | October 2025 | Monthly % Change | Yr./Yr. % Change | October 2025 | Monthly % Change | Yr./Yr. % Change |
| Composite | $664,300 | -1.3 | -6.9 | $690,000 | -1.6 | -6.5 |
| Single Family | $784,000 | -1.3 | -4.6 | $730,400 | -1.7 | -5.9 |
| Townhouse | $548,700 | 0.1 | -7.7 | $598,300 | -2.1 | -4.8 |
| Apartment | $394,200 | -3.0 | -10.3 | $448,900 | -0.9 | -6.5 |
The Bank of Canada’s recent 0.25% rate cut and its hint that rates may hold steady could give home buyers the confidence to get preapproved for a mortgage. With a good number of homes for sale in Waterloo Region, now is a good time to start looking for your next home in case we see a surge in activity into the new year.
There were 1,236 new listings added last month, an increase 7.2 per cent compared to October last year and a 28.7 per cent increase compared to the previous ten-year average for October.
The total number of homes available for sale in active status at the end of October was 2,056, an increase of 23.6 per cent compared to October of last year and 90.2 per cent above the previous ten-year average of 1,081 listings for October.
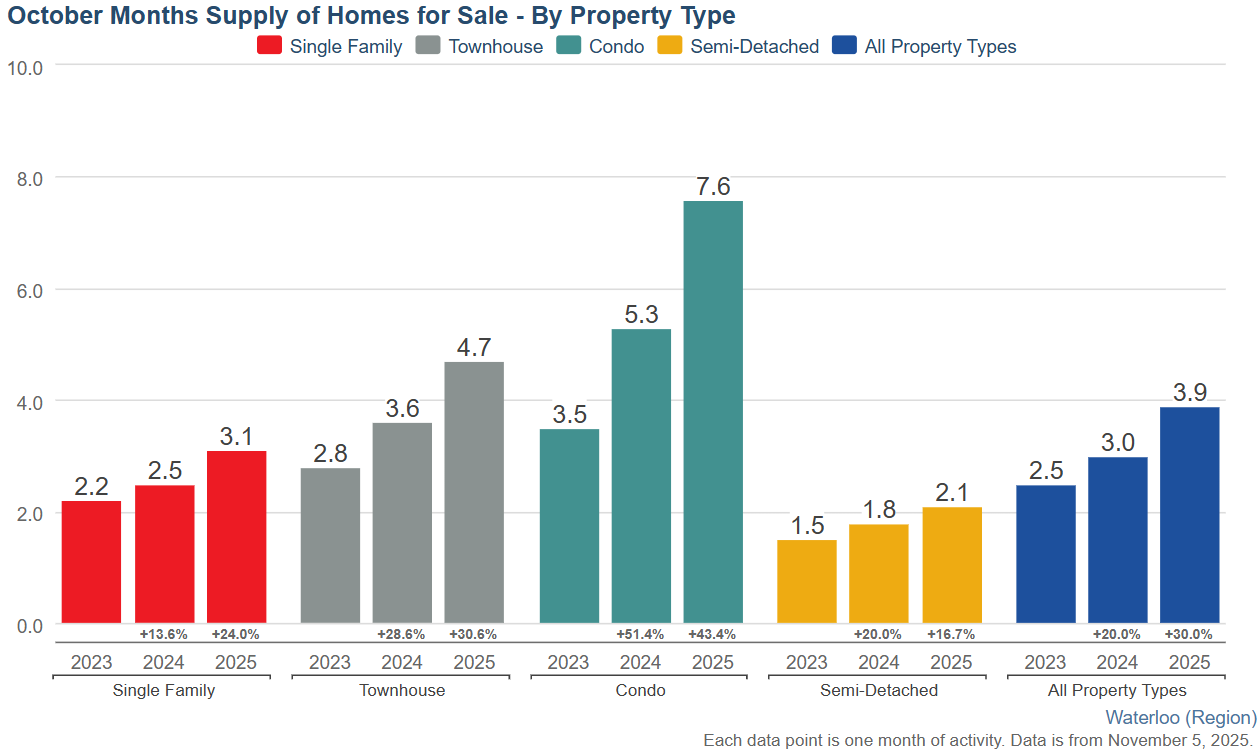
The total inventory across the market increased by 30.0 percent, resulting in a 3.9-month supply of all property types by the end of October. Condominium apartments had the highest inventory, with 7.6 months’ supply, followed by townhouses with 4.7 months’ supply and detached homes with 3.1 months’ supply. The number of months of inventory represents the time it would take to sell all current inventories at the current sales rate.
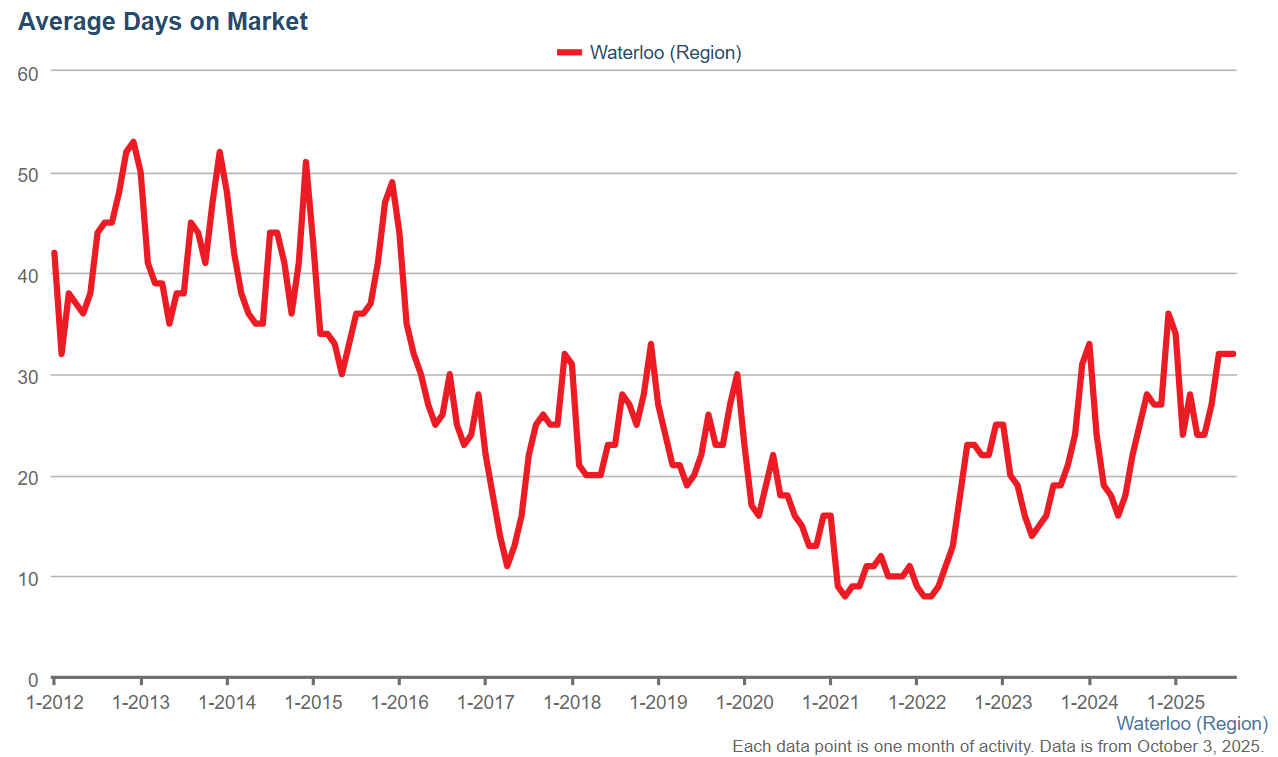
The average time to sell a home in October was 31 days, one day less than the previous month. In October 2024, it took 27 days for a home to sell, and the five-year average was 19 days.
Average Sales Price – Municipality
Average Sales Price – Township
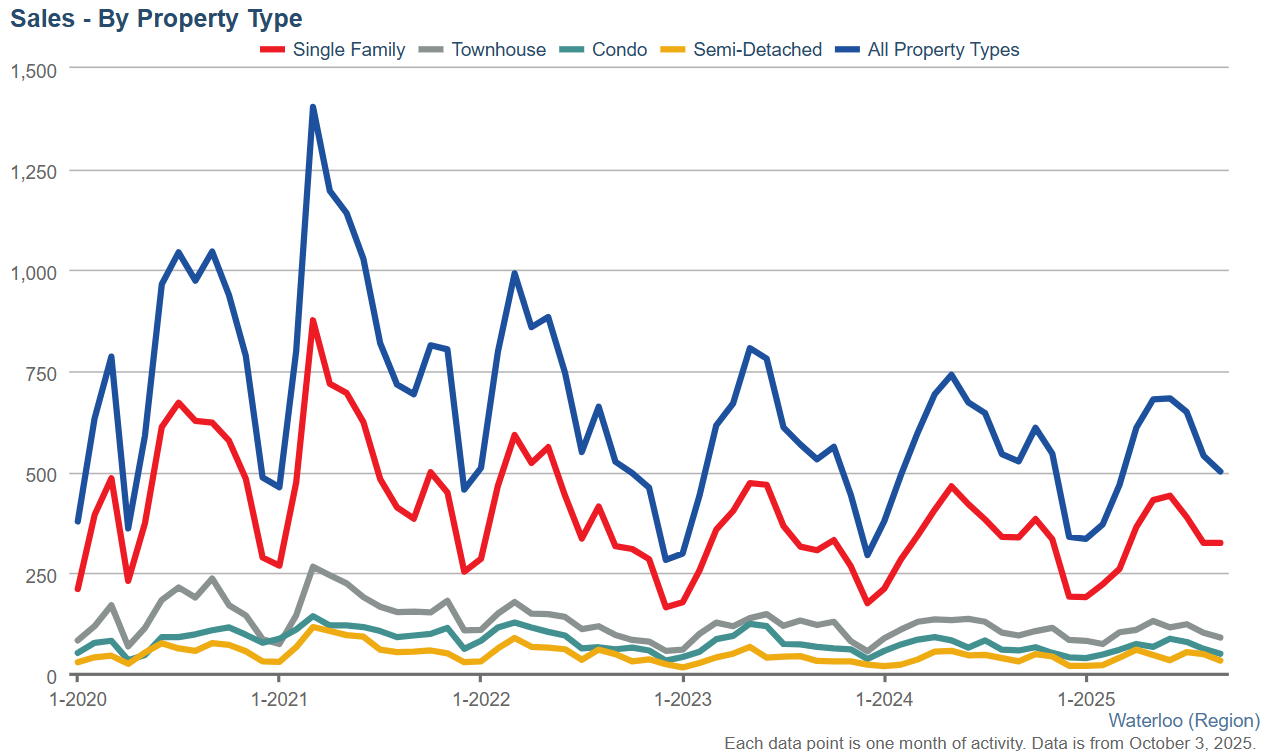
Monthly Sales By Property Type

Monthly Supply of Homes for Sale

Monthly Supply of Homes for Sale – By Property Type
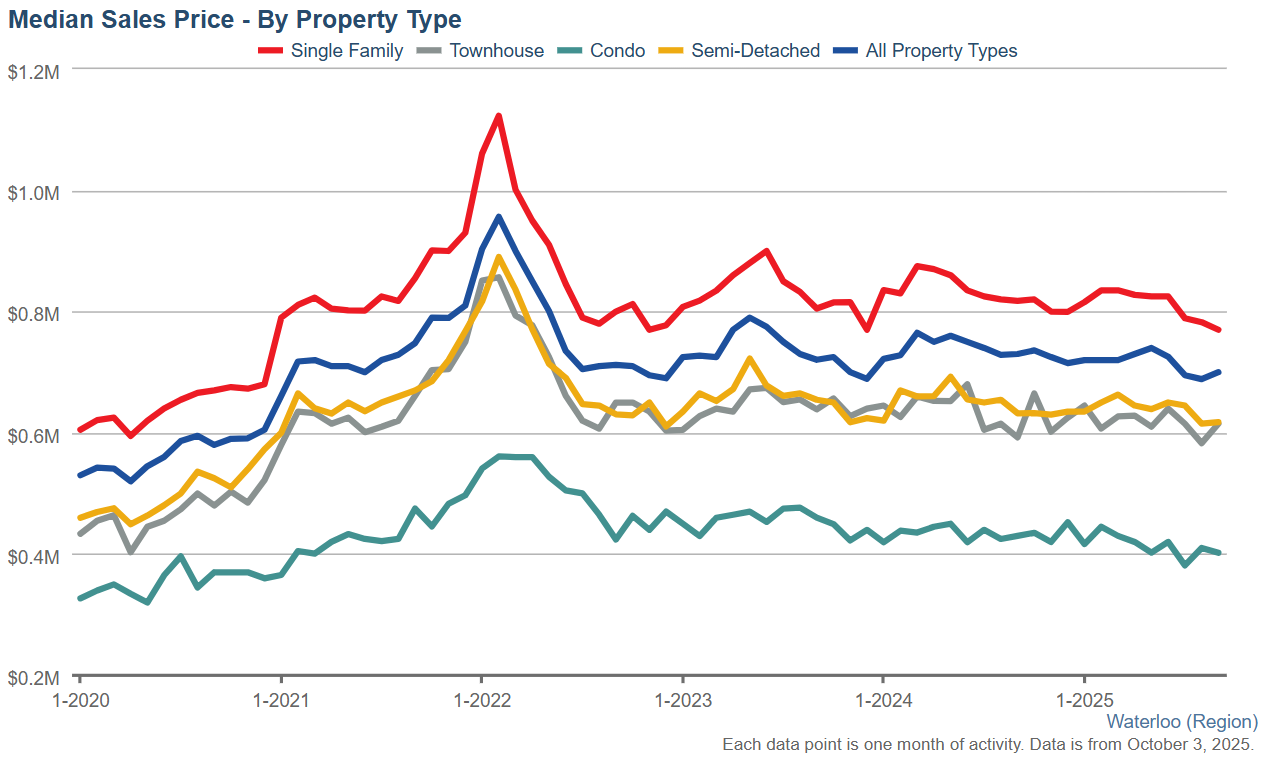
Monthly Median Sales Price – By Property Type
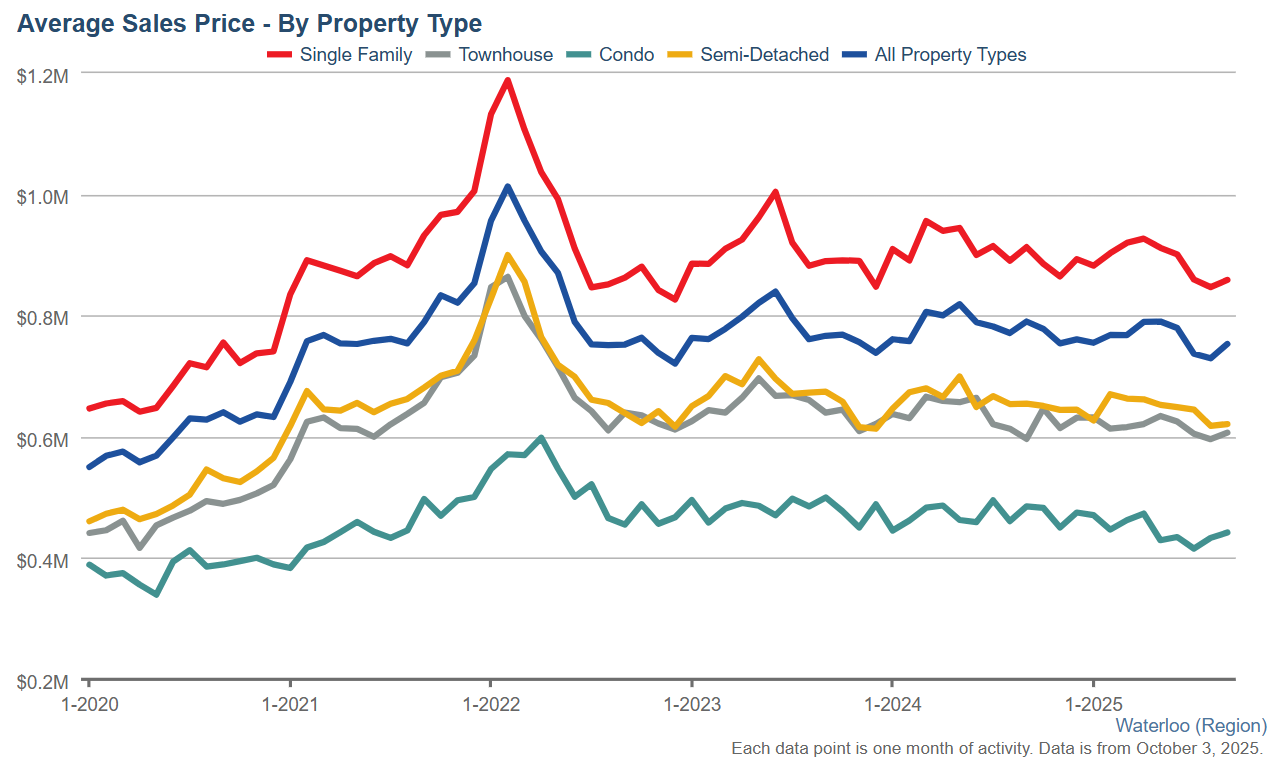
Monthly Average Sales Price – By Property Type

Monthly Average Days on Market

If you have any questions at all, are thinking of making a move this winter or are wondering what your home might be worth, give me a call or text to 519-497-4646 or shoot me an email to kevinbakerrealestate@gmail.com and we can sit down for a coffee and chat about your family’s needs going forward.
Have a great week!
Kevin
Kitchener Waterloo condo market remains Soft going into fall
I hope you had a wonderful weekend. We have been having some great weather so far this fall and I hope it continues.
The stats are out for September and things seem to be pretty balanced. We did see an uptick in activity in the past month so fingers crossed that it continues into the rest of fall. Let’s take a look at the stats…
In September, a total of 502 homes were sold. This represents a 4.7 per cent decrease compared to the same period last year and a decline of 25.0 per cent compared to the average number of homes sold in the previous ten years for the same month.
The September housing market continues to reflect broader economic conditions, with sales remaining below both last year’s levels and the ten-year average. While sales volumes have moderated from last year, this shift has created a more balanced market where buyers can take time with their decisions. Well-priced properties continue to attract attention, while homes that are priced above market value seem to be sitting on the market much longer than they should.
Total residential sales in September included 325 detached homes (down 4.1 per cent from September 2024), and 91 townhouses (down 5.2 per cent). Sales also included 51 condominium units (down 13.6 per cent) and 34 semi-detached homes (up 6.3 per cent).
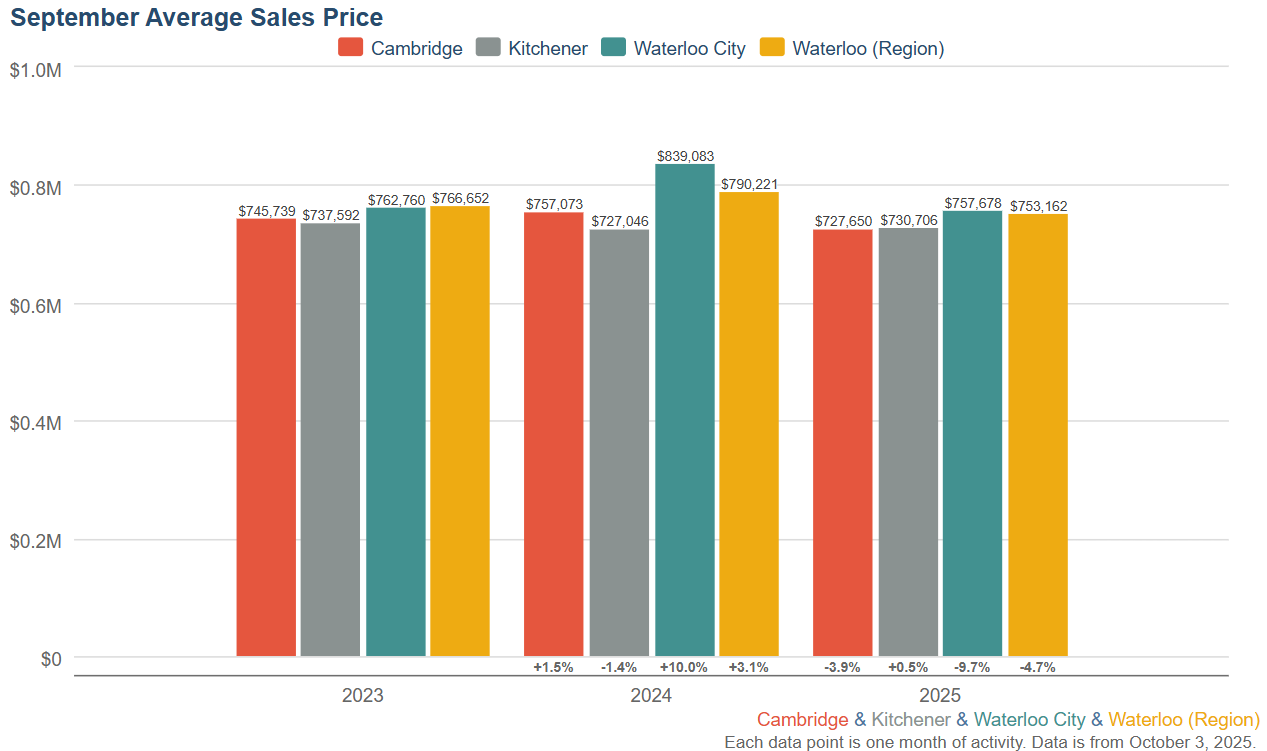
In September, the average sale price for all residential properties in Waterloo Region was $753,162. This represents a 4.7 per cent decrease compared to September 2024 and a 3.2 per cent increase compared to August 2025.
- The average sale price of a detached home was $858,872. This represents a 5.9 per cent decrease from September 2024 and an increase of 1.4 per cent compared to August 2025.
- The average sale price for a townhouse was $606,871. This represents a 1.7 per cent increase from September 2024 and an increase of 1.8 per cent compared to August 2025.
- The average sale price for an apartment-style condominium was $442,086. This represents a 8.9 per cent decrease from September 2024 and an increase of 2.0 per cent compared to August 2025.
- The average sale price for a semi was $621,026. This represents a decrease of 5.1 per cent compared to September 2024 and an increase of 0.5 per cent compared to August 2025.

| MLS® Home Price Index Benchmark Price (HPI) | ||||||
| Kitchener-Waterloo | Cambridge | |||||
| Benchmark Type: | September 2025 | Monthly % Change | Yr./Yr. % Change | September 2025 | Monthly % Change | Yr./Yr. % Change |
| Composite | $673,100 | -0.3 | -7.6 | $701,700 | 0.1 | -5.4 |
| Single Family | $794,600 | -0.1 | -5.9 | $742,700 | 0.1 | -4.5 |
| Townhouse | $548,300 | -1.3 | -9.0 | $611,500 | 0.3 | -4.7 |
| Apartment | $406,200 | -0.9 | -6.8 | $453,100 | -0.4 | -5.9 |

There were 1,469 new listings added last month, an increase 11.0 per cent compared to September last year and a 32.9 per cent increase compared to the previous ten-year average for September.
The total number of homes available for sale in active status at the end of September was 2,094, an increase of 22.2 per cent compared to September of last year and 79.5 per cent above the previous ten-year average of 1,167 listings for September.
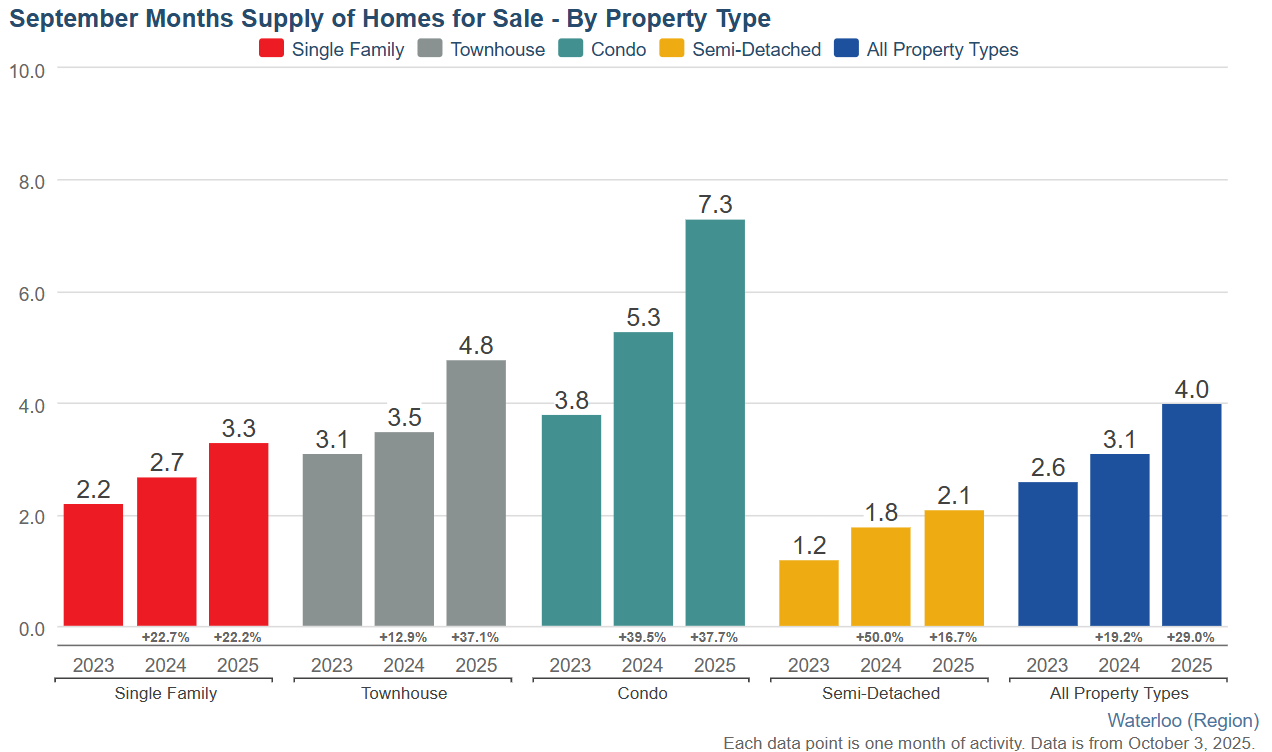
The total inventory across the market increased by 29.0 percent, resulting in a 4.0-month supply of all property types by the end of September. Condominium apartments had the highest inventory, with 7.3 months’ supply, followed by townhouses with 4.8 months’ supply and detached homes with 3.3 months’ supply. The number of months of inventory represents the time it would take to sell all current inventories at the current sales rate.
The average time to sell a home in September was 32 days, which was the same in the previous month. In September 2024, it took 28 days for a home to sell, and the five-year average was 19 days.
Average Sales Price – Municipality
Average Sales Price – Township
Monthly Sales By Property Type
Monthly Supply of Homes for Sale

Monthly Supply of Homes for Sale – By Property Type
Monthly Median Sales Price – By Property Type
Monthly Average Sales Price – By Property Type
Monthly Average Days on Market
If you have any questions at all, are thinking of making a move this fall or are wondering what your home might be worth, give me a call or text to 519-497-4646 or shoot me an email to kevinbakerrealestate@gmail.com and we can sit down for a coffee and chat about your family’s needs going forward.
Have a great Thanksgiving next weekend with your families!
Kevin
Condo Market Still Struggles in August Here in Kitchener, Waterloo and Cambridge
I hope you had a wonderful labour day long weekend. Now that the kids are back in school routines should return back to normal. Remember to drive carefully around school zones, as the little ones settle in again.
The stats are out for August, let’s take a look and see what the market is doing here in Waterloo Region.
In August, a total of 536 homes were sold. This is a decrease of 1.3 per cent compared with the same period last year and a decline of 23.1 per cent compared to the average number of homes sold in the previous ten years for the same month.
The market is showing signs of stabilization, though we’re seeing a continued cooling trend compared to last year. While sales volumes have only slightly decreased year-over-year, the more notable change is in pricing, with most property types experiencing moderate downward pressure.
Total residential sales in August included 320 detached homes (down 5.6 per cent from August 2024), and 101 townhouses (down 1.0 per cent). Sales also included 62 condominium units (up 1.6 per cent) and 50 semi-detached homes (up 25.0 per cent).
In August, the average sale price for all residential properties in Waterloo Region was $728,465. This represents a 5.5 per cent decrease compared to August 2024 and a 1.0 per cent decrease compared to July 2025.
- The average sale price of a detached home was $846,405. This represents a 4.6 per cent decrease from August 2024 and a decrease of 1.3 per cent compared to July 2025.
- The average sale price for a townhouse was $594,200. This represents a 3.2 percent decrease from August 2024 and a 1.7 percent decrease compared to July 2025.
- The average sale price for an apartment-style condominium was $433,113. This represents a 6.0 per cent decrease from August 2024 and an increase of 4.2 per cent compared to July 2025.
- The average sale price for a semi was $618,206. This represents a 5.5 per cent decrease from August 2024 and a 4.1 per cent decrease compared to July 2025.
| MLS® Home Price Index Benchmark Price (HPI) | ||||||
| Kitchener-Waterloo | Cambridge | |||||
| Benchmark Type: | August 2025 | Monthly % Change | Yr./Yr. % Change | August 2025 | Monthly % Change | Yr./Yr. % Change |
| Composite | $675,400 | -0.4 | -7.1 | $701,100 | -1.5 | -5.6 |
| Single Family | $795,400 | -0.1 | -5.2 | $742,100 | -1.7 | -4.4 |
| Townhouse | $555,400 | -1.3 | -8.5 | $609,600 | -0.2 | -6.6 |
| Apartment | $409,900 | -0.2 | -7.1 | $455,200 | -0.5 | -5.7 |

There were 1,028 new listings added last month, an increase of 3.0 per cent compared to August last year and a 11.0 per cent increase compared to the previous ten-year average for August.
The average time to sell a home in August was 32 days, which is the same as the previous month. In August 2024, it took 25 days for a home to sell, and the five-year average was 19 days.
Despite the softer market conditions, we are encouraged by the healthy increase in new listings, which gives buyers more options. While our local market statistics indicate signs of stabilization, we are operating in a complex economic environment. The Bank of Canada’s decision to maintain interest rates at 2.75% for the third consecutive time provides some predictability for both buyers and sellers. However, economic uncertainty and the Bank’s focus on inflation, especially regarding shelter costs, remind us that we are in a period where both buyers and sellers need to stay informed.
If you have any questions at all, are thinking of making a move this fall or are wondering what your home might be worth, give me a call or text to 519-497-4646 or shoot me an email to kevinbakerrealestate@gmail.com and we can sit down for a coffee and chat about your family’s needs going forward.
Have a great rest of September!
Kevin
Condo’s showing signs of a balanced market in Kitchener Waterloo
I hope you had a wonderful Canada Day! The weather lately has been great, a little hot for my liking but certainly a good reason to get outside and enjoy it.
The stats are out for June and things are looking more balanced in the Waterloo Region Real estate market. Let’s take a look…
In June, a total of 676 homes were sold. This represents a 0.3 per cent increase compared to the same period last year and a decline of 21.7 per cent compared to the average number of homes sold in the previous ten years for the same month.
While home sales in June were relatively stable year-over-year, we’re seeing a more balanced market emerge in Waterloo Region. What’s particularly notable is the increase in condominium sales – up over 34% – suggesting a lot of buyers are looking for more affordable housing options.. While more listings are coming to market, properties are taking a little longer to sell, giving buyers more time to make informed decisions during their home search.
Total residential sales in June included 442 detached homes (up 5.6 per cent from June 2024), and 113 townhouses (down 17.4 per cent). Sales also included 86 condominium units (up 34.4 per cent) and 35 semi-detached homes (down 25.4 per cent).
In June, the average sale price for all residential properties in Waterloo Region was $780,293. This represents a 1.1 per cent decrease compared to June 2024 and a 1.2 per cent decrease compared to May 2025.
- The average price of a detached home was $896,770. This represents a 0.2 per cent decrease from June 2024 and a decrease of 1.4 per cent compared to May 2025.
- The average sale price for a townhouse was $624,754. This represents a 6.0 percent decrease from June 2024 and a 1.6 percent decrease compared to May 2025.
- The average sale price for an apartment-style condominium was $435,435. This represents a 5.7 per cent decrease from June 2024 and an increase of 0.7 per cent compared to May 2025.
- The average sale price for a semi was $649,039, on par with June 2024 and a 0.5 per cent decrease compared to May 2025.
| MLS® Home Price Index Benchmark Price (HPI) | ||||||
| Kitchener-Waterloo | Cambridge | |||||
| Benchmark Type: | June 2025 | Monthly % Change | Yr./Yr. % Change | June 2025 | Monthly % Change | Yr./Yr. % Change |
| Composite | $686,100 | -2.3 | -7.5 | $723,400 | -1.5 | -4.2 |
| Single Family | $805,600 | -2.7 | -5.5 | $767,300 | -1.5 | -3.1 |
| Townhouse | $568,200 | -2.7 | -9.3 | $623,400 | -1.5 | -4.5 |
| Apartment | $417,900 | 1.5 | -8.3 | $458,200 | -0.8 | -6.6 |

There were 1,514 new listings added last month, an increase 5.3 per cent compared to June last year and a 15.1 percent increase compared to the previous ten-year average for June.
The average time to sell a home in June was 27 days, compared to 24 days in the previous month. In June 2024, it took 18 days for a home to sell, and the five-year average was 15 days.
If you have any questions at all, are thinking of making a move this summer or are wondering what your home might be worth, give me a call or text to 519-497-4646 or shoot me an email to kevinbakerrealestate@gmail.com and we can sit down for a coffee and chat about your family’s needs going forward.
Have a great rest of July!
Kevin
Condo market still very sluggish in May here in Waterloo, Kitchener and Cambridge
I hope you are having a great June so far. The nice weather is finally here and all the gardeners are loving it. The Real Estate Market here in Waterloo Region has been pretty sluggish over the past year and most notably this spring but I have noticed in the last week or two the showing activity has picked up on residential homes. The condo market is still saturated with inventory and not selling through well but prices seem to remain steady. Lets take a look at the stats for may….
In May, a total of 675 homes were sold, this represents a 9.3 per cent decrease compared to the same period last year and a decline of 26.2 per cent compared to the average number of homes sold in the previous ten years for the same month.
Total residential sales in May included 427 detached homes (down 8.4 per cent from May 2024), and 132 townhouses (down 1.5 per cent). Sales also included 67 condominium units (down 20.2 per cent) and 48 semi-detached homes (down 18.6 per cent).
In May, the average sale price for all residential properties in Waterloo Region was $789,154. This represents a 3.6 per cent decrease compared to May 2024 and a 0.8 per cent increase compared to April 2025.
- The average price of a detached home was $909,897. This represents a 3.7 percent decrease from May 2024 and a decrease of 1.0 per cent compared to April 2025.
- The average sale price for a townhouse was $634,320. This represents a 3.5 per cent decrease from May 2024 and an increase of 3.1 per cent compared to April 2025.
- The average sale price for an apartment-style condominium was $431,944. This represents a 6.7 percent decrease from May 2024 and a decrease of 9.4 per cent compared to April 2025.
- The average sale price for a semi was $652,627. This represents a decrease of 6.7 per cent compared to May 2024 and a decrease of 1.4 per cent compared to April 2025.
| MLS® Home Price Index Benchmark Price (HPI) | ||||||
| Kitchener-Waterloo | Cambridge | |||||
| Benchmark Type: | May 2025 | Monthly % Change | Yr./Yr. % Change | May 2025 | Monthly % Change | Yr./Yr. % Change |
| Composite | $702,400 | 0.6 | -6.6 | $734,300 | 1.0 | -3.4 |
| Single Family | $828,300 | 1.1 | -4.5 | $778,700 | 0.7 | -2.2 |
| Townhouse | $584,000 | -0.3 | -7.9 | $663,100 | 0.8 | -3.7 |
| Apartment | $411,600 | -6.7 | -10.2 | $462,100 | -2.0 | -6.8 |

Right now, we’re seeing a market that is different from the frenzied market of a few years ago, but that’s a good thing for buyers who have more breathing room to make decisions. The fundamentals that make Waterloo Region attractive – our diverse economy, strong tech sector, world-class educational institutes and stable governance – continue to strengthen. Waterloo Region has proven time and again that it is a solid place to invest and put down roots.
There were 1,663 new listings added last month, an increase 1.4 percent compared to May last year and a 15.6 percent increase compared to the previous ten-year average for May.
The average time to sell a home in May was 24 days, which was the same in the previous month. In May 2024, it took 16 days for a home to sell, and the five-year average was 14 days.
If you have any questions at all, are thinking of making a move this summer or are wondering what your home might be worth, give me a call or text to 519-497-4646 or shoot me an email to kevinbakerrealestate@gmail.com and we can sit down for a coffee and chat about your family’s needs going forward.
Have a great Fathers day next weekend to all the dads out there.
Kevin
Waterloo Regions Condo Market is shifting and has been for the past 8-12 months.
I hope you are having a great May so far. Looks like spring is hopefully here to stay, after this crazy winter and early spring weather we have been having. The numbers are out for Waterloo Region’s Real Estate market and we are certainly in a different environment than we have been used to for the past many years. Let’s break down the numbers and have a look….
In April, a total of 595 homes were sold in the Waterloo Region. This represents a 14.1 percent decrease compared to the same period last year and a decline of 26.7 percent compared to the average number of homes sold in the previous ten years for the same month.
Home sales in April showed typical seasonal improvement over March, but have remained notably below the ten-year average. What we’re seeing is a clear market rebalancing, with inventory levels up 75% above the ten-year average and nearly four months of supply across all property types. This shift is creating more opportunities for buyers who now have more time for due diligence and negotiations, while sellers are adapting to a market that demands strategic pricing and patience.
Total residential sales in April included 356 detached homes (down 12.5 per cent from April 2024), and 109 townhouses (down 19.9 per cent). Sales also included 71 condominium units (down 22.8 per cent) and 59 semi-detached homes (up 5.4 per cent).
In April, the average sale price for all residential properties in Waterloo Region was $789,639. This represents a 1.7 percent decrease compared to April 2024 and a 2.7 per cent increase compared to March 2025.
- The average price of a detached home was $927,591.?This represents a 1.7 percent decrease from April 2024 and an increase of 0.9 per cent compared to March 2025.
- The average sale price for a townhouse was $615,982. This represents a 7.0 percent decrease from April 2024 and a decrease of 0.2 per cent compared to March 2025.
- The average sale price for an apartment-style condominium was $473,079.?This is on par with April 2024 and an increase of 3.5 per cent compared to March 2025.
- The average sale price for a semi was $659,017. This represents a decrease of 0.7 per cent compared to April 2024 and a decrease of 0.6 per cent compared to March 2025.
Average Sale Price – Monthly

| MLS® Home Price Index Benchmark Price (HPI) | ||||||
| Kitchener-Waterloo | Cambridge | |||||
| Benchmark Type: | April 2025 | Monthly % Change | Yr./Yr. % Change | April 2025 | Monthly % Change | Yr./Yr. % Change |
| Composite | $703,500 | -3.5 | -6.1 | $730,400 | -1.4 | -3.4 |
| Single Family | $821,100 | -2.6 | -5.2 | $773,600 | -0.8 | -2.1 |
| Townhouse | $582,300 | -2.7 | -7.1 | $626,800 | -0.6 | -4.7 |
| Apartment | $441,200 | 1.6 | -3.2 | $471,800 | -2.3 | -6.4 |

There were 1,371 new listings added last month, a decrease of 4.9 percent compared to April last year and a 10.5 percent increase compared to the previous ten-year average for April.
The total number of homes available for sale in active status at the end of April was 1,936, an increase of 39.5 percent compared to April of last year and 75.3 percent above the previous ten-year average of 1,105 listings for April.
The total inventory across the market increased by 52.0 percent, resulting in a 3.8-month supply of all property types by the end of April. Condominium apartments had the highest inventory, with 8.0 months’ supply, followed by townhouses with 4.9 months’ supply and detached homes with 2.89 months’ supply. The number of months of inventory represents the time it would take to sell all current inventories at the current sales rate.
The average time to sell a home in April was 20 days, compared to 24 days in the previous month. In April 2024, it took 15 days for a home to sell, and the five-year average was 14 days.
Average Sales Price – Municipality

Average Sales Price – Township

Monthly Sales By Property Type

Monthly Supply of Homes for Sale

Monthly Supply of Homes for Sale – By Property Type

Monthly Median Sales Price – By Property Type

Monthly Average Sales Price – By Property Type

Monthly Average Days on Market

If you have any questions at all, are thinking of making a move this spring/summer or are wondering what your home might be worth, give me a call or text to 519-497-4646 or shoot me an email to kevinbakerrealestate@gmail.com and we can sit down for a coffee and chat about your family’s needs going forward.
Have a great Mother’s Day to all the mom’s out there.
Kevin
Condo Sales Cool as Inventory Reaches 9 Year high in Waterloo Region
I hope you are having a great April so far. Looks like the spring is hopefully here after that crazy weather we had on wednesday and that means an increase in activity in the Kitchener Waterloo Real Estate Market. Let’s take a look at the stats from March
In March, a total of 459 homes were sold in the Waterloo Region. This represents a 23.1 percent decrease compared to the same period last year and a decline of 45.2 percent compared to the average number of homes sold in the previous ten years for the same month.
March’s housing market shows a significant shift from last year’s dynamics, with sales activity cooling while inventory levels have reached their highest point for March since 2015. This changing landscape is providing buyers with more options and time to make informed decisions.
Total residential sales in March included 259 detached homes (down 24.7 percent from March 2024), and 98 townhouses (down 24.0 per cent). Sales also included 60 condominium units (down 29.4 per cent) and 40 semi-detached homes (up 8.1 per cent).
In March, the average sale price for all residential properties in Waterloo Region was $771,915. This represents a 4.4 per cent decrease compared to March 2024 and a 0.5 per cent increase compared to February 2025.
- The average price of a detached home was $921,985. This represents a 3.6 percent decrease from March 2024 and an increase of 2.3 per cent compared to February 2025.
- The average sale price for a townhouse was $622,231. This represents a 6.6 percent decrease from March 2024 and an increase of 1.2 per cent compared to February 2025.
- The average sale price for an apartment-style condominium was $457,925. This represents a 5.5 percent decrease from March 2024 and an increase of 4.8 per cent compared to February 2025.
- The average sale price for a semi was $663,145. This represents a decrease of 2.5 per cent compared to March 2024 and a decrease of 1.1 per cent compared to February 2025.
Average Sale Price – Monthly

| MLS® Home Price Index Benchmark Price (HPI) | ||||||
| Kitchener-Waterloo | Cambridge | |||||
| Benchmark Type: | March 2025 | Monthly % Change | Yr./Yr. % Change | March 2025 | Monthly % Change | Yr./Yr. % Change |
| Composite | $728,800 | -0.2 | -2.7 | $740,900 | -1.4 | -1.9 |
| Single Family | $843,300 | 0.3 | -2.5 | $779,500 | -1.6 | -1.3 |
| Townhouse | $598,300 | -0.3 | -3.4 | $630,600 | 0.2 | -3.2 |
| Apartment | $434,200 | -1.4 | -6.7 | $482,800 | -0.3 | -3.5 |

While both average prices and the HPI declined on a year-over-year basis, we’re seeing month-over-month price stability in most housing categories. The increased inventory, now at a 3.2-month supply, is creating a more balanced market environment compared to the tight conditions we’ve experienced over the past many years. This shift is particularly evident in the condominium segment, where we now have nearly seven months of inventory available.
There were 1,180 new listings added last month, an increase of 15.5 per cent compared to March last year and a 2.4 per cent decrease compared to the previous ten-year average for March.
The total number of homes available for sale in active status at the end of March was 1,700, an increase of 58.4 per cent compared to March of last year and 72.9 per cent above the previous ten-year average of 983 listings for March.
The total inventory across the market increased by 68.4 percent, resulting in a 3.2-month supply of all property types by the end of March. Condominium apartments had the highest inventory, with 6.9 months’ supply, followed by townhouses with 4.2 months’ supply and detached homes with 2.3 months’ supply. The number of months of inventory represents the time it would take to sell all current inventories at the current sales rate.
The average time to sell a home in March was 28 days, compared to 24 days in the previous month. In March 2024, it took 19 days for a home to sell, and the five-year average was 14 days.
Average Sales Price – Municipality

Average Sales Price – Township

Monthly Sales By Property Type

Monthly Supply of Homes for Sale

Monthly Supply of Homes for Sale – By Property Type

Monthly Median Sales Price – By Property Type

Monthly Average Sales Price – By Property Type

Monthly Average Days on Market

If you have any questions at all, are thinking of making a move this spring or are wondering what your home might be worth, give me a call or text to 519-497-4646 or shoot me an email to kevinbakerrealestate@gmail.com and we can sit down for a coffee and chat about your family’s needs going forward.
Have a great rest of your weekend!
Kevin
New listings up, sales down but prices remain stable in Kitchener Waterloo and Cambridge
I hope you are having a great March so far. Looks like the spring thaw is fast approaching and that means an increase in activity in the Kitchener Waterloo Real Estate Market. Let’s take a look at the stats from February….
In February, a total of 363 homes were sold. This represents a 26.1 percent decrease compared to the same period last year and a decline of 38.8 percent compared to the average number of homes sold in the previous ten years for the same month.
While February’s home sales were affected by concerns over tariffs and their potential impact on employment, the market showed some encouraging signs. We saw a steady increase in new listings while prices remained stable. The month’s significant snowfall created practical challenges for buyers and sellers, affecting property viewings and transactions. However, I am seeing positive indicators in the market, with consistent attendance at open houses, pre-listing appointments, steady mortgage pre-approvals, and buyers on the sidelines carefully watching for the right opportunity to make their move.
Total residential sales in February included 221 detached homes (down 21.9 percent from February 2024), and 71 townhouses (down 36.0 percent). Sales also included 47 condominium units (down 35.6 percent) and 23 semi-detached homes (down 4.2 percent).
In February, the average sale price for all residential properties in Waterloo Region was $767,800. This represents a 1.3 percent increase compared to February 2024 and a 1.8 per cent increase compared to January 2025.
- The average price of a detached home was $900,003. This represents a 1.0 per cent increase from February 2024 and an increase of 2.1 per cent compared to January 2025.
- The average sale price for a townhouse was $613,924. This represents a 2.7 percent decrease from February 2024 and a decrease of 2.6 per cent compared to January 2025.
- The average sale price for an apartment-style condominium was $437,000. This represents a 5.8 percent decrease from February 2024 and a decrease of 7.2 per cent compared to January 2025.
- The average sale price for a semi was $670,352. This represents a decrease of 0.5 percent compared to February 2024 and an increase of 6.6 percent compared to January 2025.
Average Sale Price – Monthly

| MLS® Home Price Index Benchmark Price | ||||||
| Kitchener-Waterloo | Cambridge | |||||
| Benchmark Type: | February 2025 | Monthly % Change | Yr./Yr. % Change | February 2025 | Monthly % Change | Yr./Yr. % Change |
| Composite | $729,900 | 0.0 | -0.9 | $751,300 | 0.6 | 0.6 |
| Single Family | $841,000 | -0.8 | -1.1 | $792,100 | 0.6 | 1.6 |
| Townhouse | $600,200 | 1.7 | -1.8 | $629,300 | 0.5 | -2.1 |
| Apartment | $440,400 | 2.3 | -1.9 | $484,500 | 1.1 | -2.2 |

As we navigate these shifting dynamics in the Waterloo Region housing market, it’s important to remember that while sales may be down, the increase in inventory reflects growing opportunities for buyers. Now is a great time for buyers to get out and start looking for a new home.
There were 858 new listings added last month, an increase of 7.3 percent compared to February last year and a 0.8 percent increase compared to the previous ten-year average for February.
The total number of homes available for sale in active status at the end of February was 1,450, an increase of 55.7 percent compared to February of last year and 68.7 percent above the previous ten-year average of 860 listings for February.
The total inventory across the market increased by 52.9 percent, resulting in a 2.6-month supply of all property types by the end of February. Condominium apartments had the highest inventory, with 5.9 months’ supply, followed by townhouses with 3.6 months’ supply and detached homes with 1.8 months’ supply. The number of months of inventory represents the time it would take to sell off current inventories at the current sales rate.
The average time to sell a home in February was 24 days, compared to 34 days in the previous month. Likewise, in February 2024, it took 24 days for a home to sell, and the five-year average was 15 days.
If you have any questions at all, are thinking of making a move this spring or are wondering what your home might be worth, give me a call or text to 519-497-4646 or shoot me an email to kevinbakerrealestate@gmail.com and we can sit down for a coffee and chat about your family’s needs going forward.
Have a great rest of your week!
Kevin
Average Sales Price – Municipality

Average Sales Price – Township

Monthly Sales By Property Type

Monthly Supply of Homes for Sale

Monthly Supply of Homes for Sale – By Property Type

Monthly Median Sales Price – By Property Type

Monthly Average Sales Price – By Property Type

Monthly Average Days on Market

Kitchener Waterloo Home Sales up in November over last year!
I hope you are having a great week! It looks like winter is here a little early this year but I am sure all the skiers are enjoying things already. With the snow, that reminds us that there is less than a month till Christmas, so hopefully you have a good chunk of your shopping already done.
The Waterloo region real estate stats are out for November and sales were up over last year, which is great news! Let’s take a look….
In November, a total of 539 homes were sold in the Waterloo Region. This represents a 21.1 per cent increase compared to the same period last year and a decline of 13.1 per cent compared to the average number of homes sold in the previous ten years for the same month.
Home sales have experienced a substantial increase in November compared to last year. However, sales were down from the previous month and remain below the historical averages for the area. November has shown more balanced conditions, and the increase in available homes has benefited buyers, giving them more options. We are also seeing an abundance of condo apartments still for sale in the region as well which is keeping things sluggish in that sector of the market.
Total residential sales in November included 331 detached homes (up 23.5 per cent from November 2023), and 113 townhouses (up 37.8 per cent). Sales also included 51 condominium units (down 17.7 per cent) and 44 semi-detached homes (up 37.5 per cent).
In November, the average sale price for all residential properties in Waterloo Region was $754,604. This represents a 0.2 per cent decrease compared to November 2023 and a 3.3 per cent decrease compared to October 2024.
- The average price of a detached home was $862,690. This represents a 3.1per cent decrease from November 2023 and a decrease of 2.6 per cent compared to October 2024.
- The average sale price for a townhouse was $615,222. This represents a 0.9 per cent increase from November 2023 and a decrease of 4.9 per cent compared to October 2024.
- The average sale price for an apartment-style condominium was $452,732. This represents a 0.5 per cent increase from November 2023 and a decrease of 6.2 per cent compared to October 2024.
- The average sale price for a semi was $643,672. This represents an increase of 4.5 per cent compared to November 2023 and a decrease of 1.0 per cent compared to October 2024.
Average Sale Price – Monthly

| MLS® Home Price Index Benchmark Price | ||||||
| Kitchener-Waterloo | Cambridge | |||||
| Benchmark Type: | November 2024 | Monthly % Change | Yr./Yr. % Change | November 2024 | Monthly % Change | Yr./Yr. % Change |
| Composite | $719,600 | 0.8 | 0.6 | $737,400 | -0.1 | 1.6 |
| Single Family | $828,900 | 0.9 | 2.1 | $775,000 | -0.1 | 3.3 |
| Townhouse | $592,300 | -0.4 | -4.9 | $626,700 | -0.3 | -5.3 |
| Apartment | $444,300 | 1.1 | -2.4 | $479,600 | -0.2 | -3.3 |

Current market conditions, marked by increased inventory and stable prices, suggest that now might be a good time to buy. This is especially true for those who can take advantage of lower interest rates and recent mortgage reforms. These reforms expand eligibility for 30-year mortgage amortizations to all first-time homebuyers and buyers of new construction. Additionally, a higher limit on insured mortgages will take effect on December 15, 2024.
There were 889 new listings added last month, an increase of 2.4 per cent compared to November last year and an 18.4 per cent increase compared to the previous ten-year average for November.
The total number of homes available for sale in active status at the end of November was 1,565 an increase of 20.0 per cent compared to November of last year and 57.8 per cent above the previous ten-year average of 992 listings for November.
The total inventory across the market increased by 16.7 percent, resulting in a 2.8 month supply of all property types by the end of November. Condominium apartments had the highest inventory, with 5.9 months’ supply, followed by townhouses with 3.9 months’ supply and detached homes with 2.0 months’ supply. The number of months of inventory represents the time it would take to sell off current inventories at the current sales rate.
The average time to sell a home in November was 27 days, consistent with the previous month. In November 2023, it took 24 days for a home to sell, and the five-year average was 19 days.
If you have any questions at all, are thinking of making a move this winter, or are wondering what your home might be worth, give me a call or text to 519-497-4646 or shoot me an email to kevinbakerrealestate@gmail.com and we can sit down for a coffee and chat about your family’s needs going forward.
Have a great rest of your week!
Kevin
Average Sales Price – Municipality

Average Sales Price – Township

Monthly Sales By Property Type

Monthly Supply of Homes for Sale

Monthly Supply of Homes for Sale – By Property Type

Monthly Median Sales Price – By Property Type

Monthly Average Sales Price – By Property Type

Monthly Average Days on Market

