
Kitchener Waterloo Home Sales up in November over last year!
I hope you are having a great week! It looks like winter is here a little early this year but I am sure all the skiers are enjoying things already. With the snow, that reminds us that there is less than a month till Christmas, so hopefully you have a good chunk of your shopping already done.
The Waterloo region real estate stats are out for November and sales were up over last year, which is great news! Let’s take a look….
In November, a total of 539 homes were sold in the Waterloo Region. This represents a 21.1 per cent increase compared to the same period last year and a decline of 13.1 per cent compared to the average number of homes sold in the previous ten years for the same month.
Home sales have experienced a substantial increase in November compared to last year. However, sales were down from the previous month and remain below the historical averages for the area. November has shown more balanced conditions, and the increase in available homes has benefited buyers, giving them more options. We are also seeing an abundance of condo apartments still for sale in the region as well which is keeping things sluggish in that sector of the market.
Total residential sales in November included 331 detached homes (up 23.5 per cent from November 2023), and 113 townhouses (up 37.8 per cent). Sales also included 51 condominium units (down 17.7 per cent) and 44 semi-detached homes (up 37.5 per cent).
In November, the average sale price for all residential properties in Waterloo Region was $754,604. This represents a 0.2 per cent decrease compared to November 2023 and a 3.3 per cent decrease compared to October 2024.
- The average price of a detached home was $862,690. This represents a 3.1per cent decrease from November 2023 and a decrease of 2.6 per cent compared to October 2024.
- The average sale price for a townhouse was $615,222. This represents a 0.9 per cent increase from November 2023 and a decrease of 4.9 per cent compared to October 2024.
- The average sale price for an apartment-style condominium was $452,732. This represents a 0.5 per cent increase from November 2023 and a decrease of 6.2 per cent compared to October 2024.
- The average sale price for a semi was $643,672. This represents an increase of 4.5 per cent compared to November 2023 and a decrease of 1.0 per cent compared to October 2024.
Average Sale Price – Monthly

| MLS® Home Price Index Benchmark Price | ||||||
| Kitchener-Waterloo | Cambridge | |||||
| Benchmark Type: | November 2024 | Monthly % Change | Yr./Yr. % Change | November 2024 | Monthly % Change | Yr./Yr. % Change |
| Composite | $719,600 | 0.8 | 0.6 | $737,400 | -0.1 | 1.6 |
| Single Family | $828,900 | 0.9 | 2.1 | $775,000 | -0.1 | 3.3 |
| Townhouse | $592,300 | -0.4 | -4.9 | $626,700 | -0.3 | -5.3 |
| Apartment | $444,300 | 1.1 | -2.4 | $479,600 | -0.2 | -3.3 |

Current market conditions, marked by increased inventory and stable prices, suggest that now might be a good time to buy. This is especially true for those who can take advantage of lower interest rates and recent mortgage reforms. These reforms expand eligibility for 30-year mortgage amortizations to all first-time homebuyers and buyers of new construction. Additionally, a higher limit on insured mortgages will take effect on December 15, 2024.
There were 889 new listings added last month, an increase of 2.4 per cent compared to November last year and an 18.4 per cent increase compared to the previous ten-year average for November.
The total number of homes available for sale in active status at the end of November was 1,565 an increase of 20.0 per cent compared to November of last year and 57.8 per cent above the previous ten-year average of 992 listings for November.
The total inventory across the market increased by 16.7 percent, resulting in a 2.8 month supply of all property types by the end of November. Condominium apartments had the highest inventory, with 5.9 months’ supply, followed by townhouses with 3.9 months’ supply and detached homes with 2.0 months’ supply. The number of months of inventory represents the time it would take to sell off current inventories at the current sales rate.
The average time to sell a home in November was 27 days, consistent with the previous month. In November 2023, it took 24 days for a home to sell, and the five-year average was 19 days.
If you have any questions at all, are thinking of making a move this winter, or are wondering what your home might be worth, give me a call or text to 519-497-4646 or shoot me an email to kevinbakerrealestate@gmail.com and we can sit down for a coffee and chat about your family’s needs going forward.
Have a great rest of your week!
Kevin
Average Sales Price – Municipality

Average Sales Price – Township

Monthly Sales By Property Type

Monthly Supply of Homes for Sale

Monthly Supply of Homes for Sale – By Property Type

Monthly Median Sales Price – By Property Type

Monthly Average Sales Price – By Property Type

Monthly Average Days on Market

Waterloo Region Condo Sales see’s a Decrease in September
I hope you had a great week and are looking forward to the weekend. The weather has been so nice in September but I am sure fall is just around the corner. The stats are out for September in the Waterloo Region Housing market and Sales were down once again but prices were up slightly. Let’s take a look at the numbers…
In September, a total of 521 homes were sold in the Waterloo Region. This represents a decrease of 2.1 per cent compared to the same period last year and a decline of 23.5 per cent compared to the average number of homes sold in the previous ten years for the same month.
There has been an overall slowdown in home sales, but we continued to see strong demand for detached homes, resulting in an increase in sales for that specific type of property last month. The buyers have a bit more selection than a year ago as inventory is up, and homes take a little longer to sell. This can mean a less stressful homebuying experience, but for sellers, the current market may require more patience or even adjustment in price expectation.
Total residential sales in September included 336 detached homes (up 9.4 per cent from September 2023), and 95 townhouses (down 22.1 per cent). Sales also included 57 condominium units (down 16.2 per cent) and 32 semi-detached homes (down 3.0 per cent).
In September, the average sale price for all residential properties in Waterloo Region was $788,944. This represents a 2.9 per cent increase compared to September 2023 and a 2.3 per cent increase compared to August 2024.
- The average price of a detached home was $910,286. This represents a 2.3 per cent increase from September 2023 and an increase of 2.2 per cent compared to August 2024.
- The average sale price for a townhouse was $595,435. This represents a 6.9 per cent decrease from September 2023 and a decrease of 2.7 per cent compared to August 2024.
- The average sale price for an apartment-style condominium was $483,331. This represents a decrease of 3.4 per cent from September 2023 and an increase of 4.9 per cent compared to August 2024.
- The average sale price for a semi was $654,613. This represents a decrease of 2.9 per cent compared to September 2023 and an increase of 0.1 per cent compared to August 2024.
Average Sale Price – Monthly

| MLS® Home Price Index Benchmark Price | ||||||
| Kitchener-Waterloo | Cambridge | |||||
| Benchmark Type: | September 2024 | Monthly % Change | Yr./Yr. % Change | September 2024 | Monthly % Change | Yr./Yr. % Change |
| Composite | $728,700 | 0.2 | -1.8 | $741,800 | -0.1 | 0.0 |
| Single Family | $844,400 | 0.6 | 0.3 | $777,500 | 0.2 | 1.3 |
| Townhouse | $602,800 | -0.7 | -5.5 | $641,700 | -1.7 | -4.8 |
| Apartment | $435,700 | -1.3 | -8.3 | $481,500 | -0.2 | -4.2 |

In September, the federal government made some policy changes. These changes include extending mortgage terms to 30 years for first-time homebuyers and all buyers of new builds and raising the CMHC insurance cap from $1 million to $1.5 million. These changes will come into effect later this year. Combined with anticipated further interest rate cuts, these adjustments could enable more buyers to purchase their first home.
There were 1,313 new listings added last month, a decrease of 6.5 per cent compared to September last year and a 20.0 per cent increase compared to the previous ten-year average for September.
The total number of homes available for sale in active status at the end of September was 1,751 an increase of 21.3 per cent compared to September of last year and 42.2 per cent above the previous ten-year average of 1,232 listings for September.
The total inventory across the market increased by 23.1 percent, resulting in a 3.2-month supply of all property types by the end of September. Condominium apartments had the highest inventory, with 5.5 months’ supply, followed by townhouses with 3.6 months’ supply and detached homes with 2.7 months’ supply. The number of months of inventory represents the time it would take to sell off current inventories at the current sales rate.
The average time it took to sell a home in September was 28 days, which is three days longer than the previous month. In September 2023, it took 19 days for a home to sell, and the five-year average is 18 days.
If you have any questions at all, are thinking of making a move this fall and wondering what your home might be worth, give me a call or text to 519-497-4646 or shoot me an email to kevinbakerrealestate@gmail.com and we can sit down for a coffee and chat about your family’s needs going forward.
Enjoy your Thanksgiving with your families next weekend!
Kevin
Average Sales Price – Municipality

Average Sales Price – Township

Monthly Sales By Property Type

Monthly Supply of Homes for Sale

Monthly Supply of Homes for Sale – By Property Type

Monthly Median Sales Price – By Property Type

Monthly Average Sales Price – By Property Type

Monthly Average Days on Market

Waterloo Region Condo Market cooling with increased inventory and fewer buyers
I hope you are having a great start to summer and enjoyed the Canada Day Long weekend. I know the golfers have had some mixed weather but for the most part the grass is still nice and green.
The stats are out for June and we have seen some cooling in the real estate market here in Waterloo Region. Listing inventory is growing and it seems that the buyers are staying on the sidelines waiting for rates to come down a little more. Let’s dive into the stats to take a look…
In June, a total of 674 homes were sold, which represents a decrease of 13.7 per cent compared to the same period last year and a decline of 24.8 per cent compared to the average number of homes sold in the previous ten years for the same month.
Total residential sales in June included 424 detached (down 9.6 per cent from June 2023), and 136 townhouses (down 8.7 per cent). Sales also included 66 condominium units (down 44.5 per cent) and 47 semi-detached homes (up 14.6 per cent).
In June, the average sale price for all residential properties in Waterloo Region was $790,945. This represents a 5.8 per cent decrease compared to June 2023 and a 3.3 per cent decrease compared to May 2024.
- The average price of a detached home was $900,307. This represents a 10.3 per cent decrease from June 2023 and a decrease of 4.6 per cent compared to May 2024.
- The average sale price for a townhouse was $663,642. This represents a 0.6 per cent decrease from June 2023 and an increase of 2.0 per cent compared to May 2024.
- The average sale price for an apartment-style condominium was $462,145. This represents a decrease of 1.8 per cent from June 2023 and an increase of 0.5 per cent compared to May 2024.
- The average sale price for a semi was $649,353. This represents a decrease of 6.7 per cent compared to June 2023 and a decrease of 7.2 per cent compared to May 2024.
Average Sale Price – Monthly

| MLS® Home Price Index Benchmark Price | ||||||
| Kitchener-Waterloo | Cambridge | |||||
| Benchmark Type: | June 2024 | Monthly % Change | Yr./Yr. % Change | June 2024 | Monthly % Change | Yr./Yr. % Change |
| Composite | $741,500 | -1.4 | -5.6 | $755,200 | -0.7 | -3.1 |
| Detached | $852,900 | -1.6 | -5.1 | $791,900 | -0.6 | -3.1 |
| Townhouse | $626,400 | -1.2 | -3.9 | $652,600 | -0.7 | -0.6 |
| Apartment | $455,800 | -0.5 | -4.7 | $490,600 | -1.1 | 1.6 |

The average selling price for residential properties has decreased by 5.8 per cent since June 2023, with detached homes showing the most significant drop at 10.3 percent. This indicates a broader softness in the market and a shifting from a Sellers market to a more balanced market at the moment. The silver lining is this presents a more favourable pricing environment for buyers, with more choices, greater flexibility, and the potential to negotiate better deals.
There were 1,431 new listings added last month, an increase of 7.6 per cent compared to June last year and a 10.6 per cent increase compared to the previous ten-year average for June.
The total number of homes available for sale in active status at the end of June was 1,790, an increase of 75.5 per cent compared to June of last year and 31.9 per cent above the previous ten-year average of 1,357 listings for June.
Market-wide inventory levels were up 73.7 per cent, with 3.3 months’ supply for all property types at the end of June. The property type that gained the most inventory was the condo apartment segment, which increased by 103.1 percent. That amounts to 6.5 months’ supply for condo apartments, 2.8 months for detached homes, and 3.2 months for townhouses. The number of months of inventory represents the amount of time it would take to sell off current inventories at the current sales rate.
The average number of days to sell in June was 18, compared to 15 days in June 2023. The previous 5-year average is 15 days.
If you have any questions at all, are thinking of making a move this summer and wondering what your home might be worth, give me a call or text to 519-497-4646 and we can sit down for a coffee and chat about your family’s needs going forward.
Enjoy the rest of your July!
Kevin
Average Sales Price – Municipality

Average Sales Price – Township

Monthly Sales By Property Type

Monthly Supply of Homes for Sale

Monthly Supply of Homes for Sale – By Property Type

Monthly Median Sales Price – By Property Type

Monthly Average Sales Price – By Property Type

Monthly Average Days on Market

March Home and Condo Sales Slump in March for Kitchener, Waterloo and Cambridge
I hope you had a nice Easter long weekend with the family last week and got to enjoy some time together making new memories. The Easter bunny came to our place too in the form of 4 new chickens and 2 ducks for our newly constructed coop 🙂
The stats for March came out and Waterloo Region experienced record low home sales. The market is tight for inventory once again and multiple offers are showing up for well priced homes in the 700-900k range.
Let’s take a look at the numbers….
In March, a total of 596 homes were sold, this represents a decrease of 3.2% compared to the same period last year and a decline of 33.4% compared to the average number of homes sold in the previous 5 years for the same month.
Despite the challenging market conditions, the first quarter of 2024 saw an increase in home sales, marking an 8.0 per cent rise compared to the previous year. However, these figures still fall short of the first-quarter sales of the past decade.
While home sales in Waterloo Region hit a record low for March in over two decades, we’re also witnessing a positive trend. Over the past three months, prices and activity have started to pick up, and I expect this momentum will continue into the spring.
Total residential sales in March included 344 detached (down 3.9 per cent from March 2023), and 127 townhouses (down 0.8 per cent). Sales also included 86 condominium units (down 1.1 per cent) and 37 semi-detached homes (down 11.9 per cent).
In March, the average sale price for all residential properties in Waterloo Region was $806,279. This represents a 3.6 per cent increase compared to March 2023 and a 6.6 per cent increase compared to February 2024.
- The average price of a detached home was $954,342. This represents a 4.9 per cent increase from March 2023 and an increase of 7.3 per cent compared to February 2024.
- The average sale price for a townhouse was $667,810. This represents a 4.4 per cent increase from March 2023 and an increase of 6.0 per cent compared to February 2024.
- The average sale price for an apartment-style condominium was $483,085. This represents an increase of 0.3 per cent from March 2023 and an increase of 5.3 per cent compared to February 2024.
- The average sale price for a semi was $680,039. This represents a decrease of 2.9 per cent compared to March 2023 and an increase of 1.0 per cent compared to February 2024.
Average Sale Price – Monthly

| MLS® Home Price Index Benchmark Price | ||||||
| Kitchener-Waterloo | Cambridge | |||||
| Benchmark Type: | March 2024 | Monthly % Change | Yr./Yr. % Change | March 2024 | Monthly % Change | Yr./Yr. % Change |
| Composite | $740,900 | 1.6 | 0.0 | $747,500 | 0.7 | 0.9 |
| Detached | $853,800 | 1.5 | 1.3 | $780,100 | 0.8 | 1.1 |
| Townhouse | $614,900 | 2.3 | 1.3 | $652,400 | 0.6 | 2.4 |
| Apartment | $461,900 | 2.1 | -0.7 | $490,500 | 2.8 | 3.4 |

Home prices have been gradually increasing since December, which is a typical trend that we see going into a spring market. The rate and extent of further increases will depend on the willingness and patience of potential home buyers who have been waiting for lower interest rates before making their purchase. With the Bank of Canada not anticipated to make any rate changes before its June meeting, some potential home buyers may feel stuck in limbo.
There were 1,023 new listings added last month, an increase of 18.7 per cent compared to March last year and a 15.9 percent decrease compared to the previous ten-year average for March.
The total number of homes available for sale in active status at the end of March was 1,081 an increase of 54.0 per cent compared to March of last year and 1.1 per cent below the previous ten-year average of 1,093 listings for March.
At the end of March, there were 1.9 months of inventory, a 58.3 percent increase compared to last year and 18.8 percent above the previous 10-year average. The number of months of inventory represents how long it would take to sell off current inventories at the current sales rate.
The average number of days to sell in March was 19, the same number as March 2023. The previous 5-year average was 18 days.
If you are thinking about buying a new home, It is my belief that we are going to see home prices rise throughout 2024 and once the Bank of Canada starts lowering rates the acceleration of prices will increase as buyers that have been sitting on the sidelines will jump back into the market.
If you have any questions at all, are thinking of making a move this spring and wondering what your home might be worth, give me a call or text to 519-497-4646 and we can sit down for a coffee and chat about your family’s needs going forward.
Enjoy the rest of your April and the nice weather that is coming.
Kevin
Average Sales Price – Municipality

Average Sales Price – Township

Monthly Sales By Property Type

Monthly Supply of Homes for Sale

Monthly Supply of Homes for Sale – By Property Type

Monthly Median Sales Price – By Property Type

Monthly Average Sales Price – By Property Type

Monthly Average Days on Market

Condo Sales drop in 2023 here in Kitchener, Waterloo and Cambridge
Happy New Year!! I hope that you enjoyed the holiday season and made some wonderful memories with your families. Unfortunatley it was not a white Christmas but I know those skiers out there are anxiously awaiting the snow to arrive so they can hit the slopes.
The stats are out for 2023 and the market definitly struggled in the sales catagory. With interest rates at 20 year highs and inventory still tight it kept prices relativly stable but sales down significantly. Lets take a look at the stats….
There were 6,623 homes sold in 2023, a decrease of 14.8 per cent compared to 2022, and a decline of 23.2 per cent compared to the previous 5-year average for annual sales.
On a monthly basis, there were 285 homes sold in December, a decrease of 0.7 per cent compared to December 2022, and 25.6 per cent below the previous 5-year average for the month.
It should not be a surprise to anyone that for the second year in a row, the housing market in Waterloo Region has been affected by higher interest rates, resulting in a significant decline in annual sales. This year’s sales reached their lowest point in over two decades.
The trend observed in December reflects the overall slowdown in home sales throughout the year, with sales falling behind historical levels. The last time annual sales in Waterloo Region recorded fewer than 7,000 units was the year 2000.
Total residential sales in December included 172 detached (up 3.6 per cent from December 2022), and 54 townhouses (down 6.9 per cent). Sales also included 35 condominium units (up 2.9 per cent) and 24 semi-detached homes (down 4.0 per cent).
For 2023, total residential sales included 3,901 detached (down 17.0 per cent), and 1,339 townhouses (down 6.5 per cent). Sales also included 904 condominium units (down 9.2 per cent) and 457 semi-detached homes (down 26.6 per cent).
In December, the average sale price for all residential properties in Waterloo Region was $740,697. This represents a 2.8 per cent increase compared to December 2022 and a 2.1 per cent decrease compared to November 2023.
- The average price of a detached home was $848,151. This represents a 2.6 per cent increase from December 2022 and a decrease of 4.7 per cent compared to November 2023.
- The average sale price for a townhouse was $617,023. This represents a 0.8 per cent increase from December 2022 and an increase of 1.2 per cent compared to November 2023.
- The average sale price for an apartment-style condominium was $490,816. This represents a 5.0 per cent increase from December 2022 and an increase of 9.0 per cent compared to November 2023.
- The average sale price for a semi was $613,283. This represents a decrease of 0.5 per cent compared to December 2022 and a decrease of 0.5 per cent compared to November 2023.
Average Sale Price – Monthly

On a year-to-date basis, the average sale price for all residential properties in Waterloo Region decreased 7.7 per cent to $786,033 compared to 2022.
- The year-to-date average price of a detached home was $917,907. This represents a 6.1 per cent decrease compared to 2022.
- The year-to-date average sale price for a townhouse was $653,138. This represents a 9.0 per cent decrease compared to 2022.
- The year-to-date average sale price for an apartment-style condominium was $481,877. This represents a 9.0 per cent decrease compared to 2022.
- The year-to-date average sale price for a semi was $677,831. This represents a decrease of 7.9 per cent compared to 2022.
Average Sales Price – Year-to-date
")
| Monthly MLS® Home Price Index Benchmark Price | ||||||
| Kitchener-Waterloo | Cambridge | |||||
| Benchmark Type: | December 2023 | Monthly % Change | Yr./Yr. % Change | December 2023 | Monthly % Change | Yr./Yr. % Change |
| Composite | $705,700 | -0.4 | -1.4 | $706,800 | -2.5 | -0.4 |
| Detached | $798,100 | -0.6 | -0.9 | $727,000 | -2.9 | -0.8 |
| Townhouse | $602,000 | -2.2 | 0.0 | $657,500 | -1.2 | 3.8 |
| Apartment | $471,800 | 3.5 | 2.0 | $497,700 | 1.1 | 1.6 |
| Annual MLS® Home Price Index Benchmark Price | ||||
| Kitchener-Waterloo | Cambridge | |||
| Benchmark Type: | 2023 | Yr./Yr. % Change | 2023 | Yr./Yr. % Change |
| Composite | $746,600 | -9.9 | $753,500 | -9.5 |
| Detached | $848,900 | -8.5 | $784,200 | -9.1 |
| Townhouse | $624,200 | -10.8 | $655,600 | -10.5 |
| Apartment | $475,500 | -8.7 | $485,900 | -11.1 |
")
The region’s slowing housing market echoes the overall slowdown we are seeing in the broader economy.
There were 287 new listings added last month, a decrease of 6.2 per cent compared to December of last year and a 17.9 per cent decrease compared to the previous ten-year average for December.
In 2023, 11,528 new listings were added, a decrease of 14.4 per cent compared to 2022, and a 4.4 per cent decrease compared to the previous ten-year annual average.
The total number of homes available for sale in active status at the end of December was 779, an increase of 36.0 per cent compared to December of last year and 5.8 per cent above the previous ten-year average of 736 listings for December.
The number of months of inventory is up 55.6 per cent compared to December of last year, but still historically low at 1.4 months. Between 2010 and 2015, December’s rolling 12-month average was 3.5 months. The number of months of inventory represents how long it would take to sell off current inventories at the current sales rate.
The average number of days to sell in December was 30, compared to 25 days in December 2022. The previous 5-year average is 23 days.
The average days to sell in 2023 was 19 days, compared to 14 days in 2022 and a previous 5-year average of 18 days.
If you have any questions, wondering what the home down the street sold for or are thinking of making a move in the coming months, feel free to give me a call or text at 519-497-4646 or email Kevinbakerrealestate@gmail.com and we can set up a time to get together for a coffe and discuss your families plans.
Have a great January
Kevin
Average Sales Price – Municipality

Average Sales Price – Township

Monthly Sales By Property Type

Monthly Supply of Homes for Sale

Monthly Median Sales Price – By Property Type

Monthly Average Sales Price – By Property Type

Monthly Average Days on Market
Waterloo Region Condo Prices Edging Up but Inventory Still Low
Hope all is well with you and your family. It looks like spring is here and hopefully the nicer weather will be here to stay very soon. Taking a look at the Waterloo Region Real Estate Market, sales are still down but prices are edging up mostly due to the tightening of inventory once again. The GTA buyers have returned as well which is providing increased demand for housing. Lets take a look at the stats….
Sales volume remained subdued last month, with 670 homes sold in April, representing a decrease of 22.0 per cent compared to April 2022 and 18.0 percent below the previous 5-year average for the month.
The local spring market is off to a slower than usual start with half the number of new listings hitting the market than this time last year. However, with demand continuing to outstrip supply, we saw prices increase on a month-over-month basis as total sales volume continues to waver well below historical figures for the month of April.
Total residential sales in April included 404 detached (down 22.8 per cent from April 2022), and 119 townhouses (down 20.7 per cent). Sales also included 95 condominium units (down 18.1 per cent) and 51 semi-detached homes (down 25.0 per cent).
In April, the average sale price for all residential properties in Waterloo Region was $797,716. This represents an 11.9 per cent decrease compared to April 2022 and a 2.6 per cent increase compared to March 2023.
- The average price of a detached home was $925,219. This represents a 10.7 per cent decrease from April 2022 and an increase of 1.7 per cent compared to March 2023.
- The average sale price for a townhouse was $664,519. This represents a 12.7 per cent decrease from April 2022 and an increase of 3.9 per cent compared to March 2023.
- The average sale price for an apartment-style condominium was $488,971. This represents a decrease of 18.3 per cent from April 2022 and an increase of 1.5 per cent compared to March 2023.
- The average sale price for a semi was $686,792. This represents a decrease of 10.1 per cent compared to April 2022 and a decrease of 1.9 per cent compared to March 2023.

| MLS® Home Price Index Benchmark Price | ||||||
| Kitchener-Waterloo | Cambridge | |||||
| Benchmark Type: | April 2023 | Monthly % Change | Yr./Yr. % Change | April 2023 | Monthly % Change | Yr./Yr. % Change |
| Composite | $759,600 | 2.7 | -14.7 | $774,500 | 3.8 | -12.8 |
| Detached | $865,100 | 3.0 | -13.0 | $809,300 | 4.3 | -12.0 |
| Townhouse | $611,600 | 1.9 | -20.3 | $647,000 | 0.8 | -17.1 |
| Apartment | $484,900 | 2.3 | -13.4 | $491,900 | 1.8 | -16.0 |

Waterloo Region remains a sellers’ market, and while prices have fallen in comparison to last year, we anticipate that home prices will continue to increase steadily. Some stability in mortgage rates has brought about a return of buyer activity as we begin to observe a return of multiple offer scenarios, bidding wars, and a decrease in the number of days properties take to sell.
There were 869 new listings added last month, a decrease of 49.4 per cent compared to April of last year and a 33.2 per cent decrease compared to the previous ten-year average for April.
The total number of homes available for sale in active status at the end of April was 703, a decrease of 25.9 per cent compared to April of last year and 49.7 per cent below the previous ten-year average of 1397 listings for April.
The number of months of inventory is up 8.3 per cent compared to April of last year, but still historically low at 1.3 months. The number of months of inventory represents how long it would take to sell off current inventories at the current sales rate.
The average number of days to sell in April was 16, compared to 9 days in April 2022. The previous 5-year average is 16 days.
Average Sales Price – Municipality

Average Sales Price – Township

Monthly Sales By Property Type

Monthly Supply of Homes for Sale

Monthly Median Sales Price – By Property Type

Monthly Average Sales Price – By Property Type

Monthly Average Days on Market

The Real Estate market is changing very quickly, so If you are thinking of buying or selling this spring or summer, wondering what the neighbor’s place sold for, or have any questions at all, give me a call, text at 519-497-4646 or shoot me an email to kevinbakerrealestate@gmail.com
Enjoy a wonderful May and Happy Early Mothers Day to all the Mom’s!
Kevin
Condo Prices and Sales Continue to fall in Kitchener Waterloo
I hope you and your family are doing well and enjoying the beautiful August weather we are having. Hopefully if you are in town you have also been able to enjoy some wonderful free music at the Kitchener Blues Festival going on all weekend!
The Stats are out for July and things are still trending up on available homes for sale and trending down on average prices throughout the region. The stress of increasing mortgage rates are putting more pressure on the consumers ability to purchase a home which keeps prices from finding a bottom at this point.
There were 550 residential homes were sold in July, a decrease of 32.8 per cent compared to July 2021, and 32.3 per cent below the previous 5-year average for the month. We’re seeing a clear shift in the market and what people can afford to purchase or are willing to pay. On the bright side for buyers, it’s not the extreme sellers’ market it was.
Total residential sales in July included 337 detached (down 30.4 per cent from July 2021), and 112 townhouses (down 32.9 per cent). Sales also included 65 condominium units (down 39.3 per cent) and 36 semi-detached homes (down 41.0 per cent).
In July, the average sale price for all residential properties in Waterloo Region was $752,301. This represents a 1.2 per cent decrease compared to July 2021 and a 4.9 per cent decrease compared to June 2022.
- The average price of a detached home was $842,241. This represents a 6.0 per cent decrease from July 2021 and a decrease of 7.0 per cent compared to June 2022.
- The average sale price for a townhouse was $642,750. This represents a 3.6 per cent increase from July 2021 and a decrease of 3.3 per cent compared to June 2022.
- The average sale price for an apartment-style condominium was $521,731. This represents an increase of 20.4 per cent from July 2021 and an increase of 4.1 per cent compared to June 2022.
- The average sale price for a semi was $661,087. This represents an increase of 1.0 per cent compared to July 2021 and a decrease of 5.4 per cent compared to June 2022.

| MLS® Home Price Index Benchmark Price | ||||||
| Kitchener-Waterloo | Cambridge | |||||
| Benchmark Type: | July 2022 | Monthly % Change | Yr./Yr. % Change | July 2022 | Monthly % Change | Yr./Yr. % Change |
| Composite | $749,000 | -5.3 | 1.1 | $776,900 | -3.9 | 3.4 |
| Detached | $827,100 | -5.6 | -0.8 | $789,600 | -4.2 | 1.3 |
| Townhouse | $642,500 | -5.1 | 10.5 | $760,500 | -2.6 | 17.7 |
| Apartment | $524,800 | -2.3 | 17.4 | $584,700 | -0.0 | 20.1 |

The real estate market is cooling across the province, and we are seeing significantly fewer buyers from the GTA, which is also impacting prices, however, this is not entirely bad news since the previous market was not sustainable. The surprising thing is we are seeing rents continue to rise. The demad for rental properties has increased which is putting pressure there as well.
There were 1,174 new listings added last month, an increase of 34.0 per cent compared to July of last year, and a 9.2 per cent increase compared to the previous ten-year average for July.
The total number of homes available for sale in active status at the end of July was 1,283, an increase of 215.2 per cent compared to July of last year, and 19.5 per cent below the previous ten-year average of 1593 listings for July.
The number of months of inventory was 1.7 months in July, as it was in June. While this is still at historic lows, the last time it was near this range was September of 2019 when it was 1.6 months. The number of months of inventory represents how long it would take to sell off current inventories at the current sales rate.
The average number of days to sell in July was 18, compared to 11 days in July 2021. The previous 5-year average is 17 days.
Average Sales Price – Municipality

Average Sales Price – Township

Monthly Sales By Property Type

Monthly Supply of Homes for Sale

Monthly Median Sales Price – By Property Type

Monthly Average Sales Price – By Property Type

Monthly Average Days on Market

If you are thinking of buying or selling this summer and fall, wondering what the neighbor’s place sold for, or have any questions at all, give me a call, text at 519-497-4646 or shoot me an email to kevinbakerrealestate@gmail.com
Enjoy the nice weather and have a great rest of the summer!
Kevin
Waterloo Region 2021 Real Estate Market Update
Happy New Year! I truely hope that you and your family enjoyed a wondeful holiday season and 2022 brings you a renewed sense of normal that we are all certainly looking forward too after the last couple of years.
2021 was another crazy year for Real Estate here in Waterloo Region. We blew away records in sales volume and the average price for a single detached home surpassed the 1 million dollar mark for the first time ever.
Lets look at all the numbers…
The 7,581 residential homes sold in 2021 represent an increase of 18.3 per cent compared to last year’s record-setting number of sales that ended the year 2020.
On a monthly basis, there were 344 residential homes sold last month, a decrease of 1.7 percent compared to the same month last year.
Home sales in 2021 have absolutely smashed last year’s record by more than 1,000 units. While this is a good time to sell your home, it remains a tremendously difficult market for buyers. Affordability for all types of housing within our community continues to be a concern which we expect to continue throughout 2022.
Total residential sales in December included 177 detached (down 12.4 percent from December 2020), and 56 condominium units (down 11.1 percent). Sales also included 23 semi-detached homes (up 9.5 percent) and 88 townhouses (up 37.5 percent).
For 2021 total residential sales included 4,272 detached (up 10.8 percent), and 1,127 condominium units (up 43.4 percent). Sales also included 578 semi-detached homes ( up 31.1 percent) and 1,602 townhouses ( up 20.9 percent).
In December, the average sale price for all residential properties in the Kitchener-Waterloo area was $842,014. This represents a 32.5 per cent increase over December 2020 and a 2.5 per cent increase compared to November 2021.
- The average price of a detached home was $1,021,353. This represents a 34.7 per cent increase from December 2020 and an increase of 3.4 percent compared to November 2021.
- The average sale price for an apartment-style condominium was $500,352. This represents an increase of 30.6 percent from December 2020 and an increase of 1.0 percent compared to November 2021.
- The average sale price for a townhouse was $717,475. This represents a 39.4 per cent increase from December 2020 and an increase of 2.1 percent compared to November 2021.
- The average sale price for a semi was $770,246. This represents an increase of 33.5 percent compared to December 2020 and an increase 7.3 percent compared to November 2021.
On a year-to-date basis, the average sale price for all residential properties in the Kitchener-Waterloo area increased 25.8 per cent to $770,596 compared to 2020.
- The year-to-date average price of a detached home was $920,726. This represents a 28.0 percent increase compared to 2020.
- The year-to-date average sale price for an apartment-style condominium was $448,208. This represents an increase of 17.3 compared to 2020
- The year-to-date average sale price for a townhouse was $632,875. This represents an increase of 34.9 percent compared to 2020.
- The year-to-date average sale price for a semi was $673,543. This represents an increase of 29.4 percent compared to 2020.

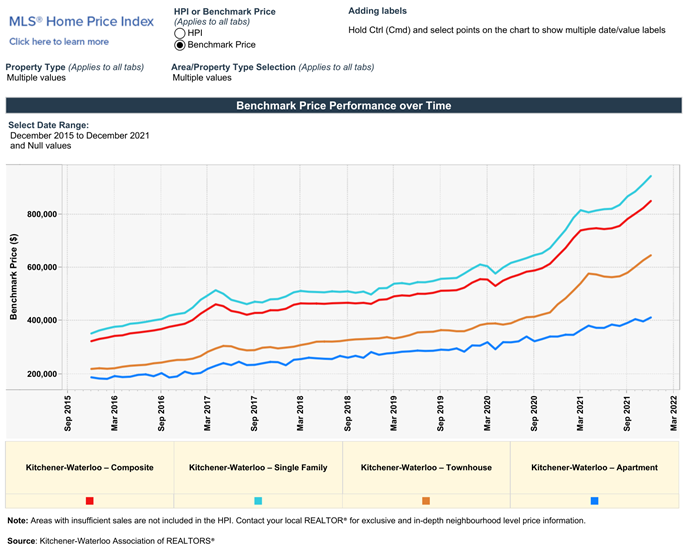
KWAR cautions that average sale price information can be useful in establishing long-term trends but should not be used as an indicator that specific properties have increased or decreased in value. The MLS® Home Price Index (HPI) provides the best way to gauge price trends because averages are strongly distorted by changes in the mix of sales activity from one month to the next.
The MLS® HPI composite benchmark price for all residential properties in Kitchener-Waterloo was $851,700 in December. This represents a 32.1 per cent increase over December 2020 and a 3.2 per cent increase compared to November 2021.
- The benchmark price for a detached home was $945,600. This represents a 33.5 per cent increase from December 2020 and 3.3 percent increase compared to November 2021.
- The benchmark price for an apartment-style condominium was $412,700. This represents a 21.1 percent increase from December 2020 and a 3.7 percent increase compared to November 2021.
- The benchmark price for a townhouse is $647,000. This represents a 40.0 percent increase from December 2020 and a 3.0 per cent increase compared to November 2021.
There were 291 new listings added in KW and area last month, an increase of 1.7 percent compared to December of last year, and a 14.6 percent increase compared to the previous ten-year average for December.
On a year-to-date basis, there were 9,040 new listings added in KW and area in 2021, an increase of 11.5 percent compared to 2020, and a 3.8 percent increase compared to the previous ten-year annual average.
The total number of homes available for sale in active status at the end of December was 104, a decrease of 45.3 percent compared to December of last year, and 85.7 percent below the previous ten-year average of 727 listings for December.
The number of months of inventory touched an all-time low of 0.2 in December. Inventory has settled at under 1 month for fourteen consecutive months. The number of months of inventory represents how long it would take to sell off current inventories at the current rate of sales.
Supply not keeping up with demand was the new normal in 2021, and unfortunately I expect that will continue to be the case in the year ahead. We need all levels of government working together to bring more supply into the housing market.
The average number of days to sell in December stayed at 10 days, compared to 16 days in December 2020 and a previous 5-year average of 28 days.
The average days to sell in 2021 was 10 days, compared to 16 days in 2020 and a previous 5-year average of 22 days.
If you are thinking of buying or selling in the coming months, wonder what the neighbor sold for, or have any questions at all, give me a call, text at 519-497-4646 or shoot me an email to kevinbaker@kwhometeam.ca.
Have a wonderful January and enjoy all the winter activities the region has to offer.
Kevin
November hits record sales and low inventories for Kitchener Waterloo condo market
I hope you and your family are doing well. Looks like winter is here and christmas is just around the corner.
The stats are out for November and it was another crazy month in the Waterloo region’s real estate market. Lets look at the numbers…
There were 597 residential homes sold last month setting a new record high for November. Compared to the same month last year, November sales were up 4.4% and on par with last month. The previous ten-year average number of residential sales for November is 446.
The elevated pace of home sales we’ve seen for the past year and a half showed no sign of slowing down in November, despite some speculation of there being a housing market correction in store for Waterloo Region.
Total residential sales in November included 324 detached (down 3.9 per cent from November 2020), and 106 condominium units (up 27.7 per cent). Sales also included 30 semi-detached homes (down 25 per cent) and 136 townhouses (up 21.4 per cent).
In November, the average sale price for all residential properties in the Kitchener-Waterloo area was $821,969. This represents a 28.9 per cent increase over November 2020 and a 2 per cent decrease compared to October 2021.
- The average price of a detached home was $990,447. This represents a 31 per cent increase from November 2020 and a decrease of 0.6 per cent compared to October 2021.
- The average sale price for an apartment-style condominium was $494,548. This represents an increase of 23.5 per cent from November 2020 and an increase of 7.1 per cent compared to October 2021.

The MLS® HPI composite benchmark price for all residential properties in Kitchener-Waterloo was $825,000 in November. This represents a 34.1 per cent increase over November 2020 and a 2.6 per cent increase compared to October 2021.
- The benchmark price for a detached home was $915,800. This represents a 35.8 per cent increase from November 2020 and 3.2 per cent increase compared to October 2021.
- The benchmark price for a townhouse is $627,900. This represents a 45.5 per cent increase from November 2020 and a 4.0 per cent increase compared to October 2021.

Lack of supply continues to be the driver in November, with inventory hitting an all time low, it is a tough time to be house hunting right now.
There were 605 new listings added to the MLS® System in KW and area last month, an increase of 3.2 per cent compared to November of last year, and a 14.6 per cent decrease compared to the previous ten-year average for November.
The total number of homes available for sale in active status at the end of November was 207, a decrease of 40.2 per cent compared to November of last year, and 80.7 per cent below the previous ten-year average of 1,071 listings for November.
The number of months of inventory reached an all time low of 0.3 in November. Inventory has settled at under 1 month for thirteen consecutive months. The number of months of inventory represents how long it would take to sell off current inventories at the current rate of sales.
The average number of days to sell in November stayed at 10 days, compared to 14 days in November 2020 and a previous 5-year average of 24 days.
The housing market typically slows down around the holiday season, but we are seeing a busier than normal December. There is growing anxiety out there among buyers caused by the fear of missing out against rumblings of interest rates eventually going up in the year ahead.
Historical Sales by Property Type

Months Supply of Homes for Sale

Historical Median Sales Price – By Property Type

Historical Average Sales Price – By Property Type


If you are thinking of buying or selling in the coming months, wonder what the neighbor sold for, or have any questions at all, give me a call, text at 519-497-4646 or shoot me an email to kevinbaker@kwhometeam.ca.
Have a wonderful holiday season with your family and a prosperous 2022!
Kevin
Euphoria Continues in the Kitchener Waterloo Condo Market
Hope you and your family have been doing well and everyone is staying safe. With lockdowns being lifted in many regions across Ontario, everyone is trying to get back to a normal life again. I will say that lockdowns or not, the housing market is starting to experience a little bit of euphoria from buyers in my opinion and certainly speculative buying. With many buyers especially from the GTA looking for homes in our region, it is pushing prices up fast.
Lets look at the stats from February…
There were 597 residential homes sold, an increase of 27.8 per cent compared to February 2020, and an increase of 66.7 per cent compared to the previous month. The previous 10-year average number of residential sales for February is 407.
Total residential sales in February included 337 detached (up 23.9 per cent from February 2020), and 101 condominium units (up 57.8 per cent). Sales also included 47 semi-detached homes (up 46.9 per cent) and 112 townhouses (up 13.1 per cent).
In February, the average sale price of all residential properties sold in 2021 increased by 32.1 per cent to $752,289 compared to the same month last year. Meanwhile, the average price of a detached home hit yet another new milestone by exceeding 900-thousand-dollars for the first time, coming in at $910,126 an increase of 35.4 per cent. During this same period, the average sale price for an apartment-style condominium was $415,322 for an increase of 11.9 per cent. Townhomes and semis sold for an average of $609,566 (up 37.5 per cent) and $684,787 (up 41.1 per cent) respectively.
We are continuing to see a dramatic increases in the average price in February due to the persistent and fierce competition for homes in our region combined with short supply, this is frustrating buyers in the hyper competitive market.
The low inventory and mortgage rates are resulting in multiple offers, higher prices and creating a fear they are missing out on the chance to become homeowners in this unprecedented market.
The rise in the average price we’ve been tracking the past several months has included some exceptional sale prices. That’s why this month and going forward we will also be including the MLS® HPI to provide a clearer picture of our local housing market trends.
The MLS® HPI is a sophisticated statistical model and more stable price indicator than average or median price measures because it considers how the features of a home affects its price – such as age, number of bedrooms, and number of bathrooms.
The MLS® Home Price Index composite benchmark price for all residential properties in Kitchener-Waterloo was $709,600 in February. This represents a 27.9 per cent increase over February 2020 and a 5.6 per cent increase compared to January 2021.
The benchmark price for a detached home was $788,500. This represents a 28.8 per cent increase from February 2020 and 6.1 per cent increase compared to January 2021.
The benchmark price for an apartment-style condominium was $341,200. This represents a 13.9 per cent increase from February 2020 and a 0.1 per cent increase compared to January 2021.
The benchmark price for a townhouse is $526,700. This represents a 33.1per cent increase from February 2020 and a 6 per cent increase compared to January 2021.
There were 737 new listings added to the MLS® System in KW and area last month, an increase of 21 per cent compared to February of last year, and a 15.7 per cent increase compared to the previous ten-year average for February.
The total number of homes available for sale in active status at the end of February was 295, a decrease of 33.6 per cent compared to February of last year, and 73 per cent below the previous ten-year average of 1,096 listings for February.
The number of months of inventory was 0.5 in February and has numbered less than 1 month since October. The number of months of inventory represents how long it would take to sell off current inventories at the current rate of sales.
The average number of days to sell in February was 10 days, compared to 17 days in February 2020 and a previous 5-year average of 33 days.
If you are thinking of buying or selling in the coming months, wonder what the neighbor sold for, or have any questions at all, give me a call, text at 519-497-4646 or shoot me an email to kevinbaker@kwhometeam.ca.
Have a wonderful weekend and stay safe!
Kevin
Recap of 2020 Home and Condo market in Waterloo region.
How was your Christmas and New years? Mother nature was nice enough to give us a white christmas and since then we have had some great weather to get outside and do some hiking or other winter activites. I know with covid it was a very different year for all of us but i trust you were able to get some time with family and friends in some form.
The stats are out and thought i would share them to keep you up to date on our crazy housing market. It was a year of fast paced upward movement in home and condo prices here in Waterloo Region. Have a look below to see the stats….
There were 6,492 residential homes sold in 2020, an increase of 9 per cent compared to 2019. Compared to previous years, 2020’s annual sales were 5 per cent above the previous 5-year average, and 11.6 per cent above the previous 10-year average.
On a monthly basis, there were 42 per cent more home sales compared to last year, with 351 home sales in the month of December.
December’s home sales were the highest on record for the month. This marks the sixth consecutive month of record home sales in Kitchener-Waterloo and helps propel 2020’s annual number of transactions over the 6,000-unit threshold for only the third time in our history.
Total residential sales in December included 204 detached (up 46.7 per cent), and 63 condominium units (up 34 per cent) which includes any property regardless of style (i.e., semis, townhomes, apartment, detached etc.). Sales also included 20 semi-detached homes (down 9.1 per cent) and 64 freehold townhouses (up 68.4 per cent).
For 2020, total residential sales included 3,899 detached (up 8.1 per cent), and 804 condominium units (up 18.9 per cent) which includes any property regardless of style (i.e., semis, townhomes, apartment, detached etc.). Sales also included 450 semi-detached homes (up 6.8 per cent) and 1,346 freehold townhouses (up 7 per cent).
In December, the average sale price of all residential properties sold in 2020 increased by 14.4 per cent to $634,545 compared to 2019. Detached homes sold for an average price of $755,618 an increase of 11.9 per cent compared to 2019. During this same period, the average sale price for an apartment-style condominium was $383,196 for an increase of 5.4 per cent. Townhomes and semis sold for an average of $514,760 (up 27.7 per cent) and $574,659 (up 20.2 per cent) respectively.
On a year-to-date basis, the average sale price of all residential properties sold in 2020 increased by 16.1 per cent to $612,521 compared to 2019. Detached homes sold for an average price of $719,203 an increase of 16.9 per cent compared to 2019. During this same period, the average sale price for an apartment-style condominium was $391,698 for an increase of 13.7 per cent. Townhomes and semis sold for an average of $468,891 (up 14.6 per cent) and $520,753 (up 18.3 per cent) respectively.
The median price of all residential properties sold last year increased 17.3 per cent to $575,000 and the median price of a detached home during the same period increased 15.7 per cent to $660,000.
With more people working from home, some permanently, space has become a greater concern than ever before. When you combine this with all the other great attributes of our region, it is no surprise that Waterloo Region is putting up these kinds of numbers.
Like many other parts of Ontario, low inventory has become a defining factor of Waterloo Region’s housing market and the new normal. The number of months of inventory remained at just 1 month or less throughout most of 2020.
For historical context, the number of months inventory in Kitchener-Waterloo between 2011 and 2015 averaged 4. Between 2016 and 2020 it was a monthly average of 1.5 months. The number of months of inventory represents how long it would take to sell off current inventories at the current rate of sales.
The average number of days to sell in 2020 was 16 days, compared to 23 days in 2019 and a previous 5-year average of 27 days.
Dollar volume of all residential real estate sold last year increased 26.5 per cent to $3.9 billion compared with 2019.
Looking to the year ahead, we should expect more of the same. Real estate continues to be one of the shining lights supporting the Ontario economy, so we do not expect to see any significant efforts to try to cool the market. Buyers should continue to expect stiff competition in Waterloo Region, and for sellers, there will continue to be a strong interest for all properties entering the market.


If you are thinking of buying or selling in the coming months, wonder what the neighbor sold for, or have any questions at all, give me a call, text at 519-497-4646 or shoot me an email to kevinbaker@kwhometeam.ca.
Have a wonderful weekend and stay safe!
Kevin
