
February Sales Down But Prices Remain Steady
I hope you and your family are enjoying a wonderful weekend and survived the house dumping of snow we received last night. The February Real Estate stats are out for Waterloo region and inventory is tight and sales continue to stay low as prices are remaining steady. Lets take a look at the numbers…
Sales volume set a new low for the month of February, with 439 homes sold, representing a decrease of 45.0 per cent compared to February 2022 and 31.5 per cent below the previous 5-year average for the month.
Once again, we experienced record low listing sales in February, Increased borrowing costs, coupled with a shortage of housing supply and strong demand, have put a strain on prospective buyers as affordability continues to be a top concern; however, home prices have remained stable for the past several months.
Total residential sales in February included 256 detached (down 45.3 per cent from February 2022), and 100 townhouses (down 33.3 per cent). Sales also included 55 condominium units (down 52.6 per cent) and 28 semi-detached homes (down 56.3 per cent).
In February, the average sale price for all residential properties in Waterloo Region was $758,698. This represents a 25.1 per cent decrease compared to February 2022 and a 0.6 per cent decrease compared to January 2023.
- The average price of a detached home was $877,884. This represents a 26.0 per cent decrease from February 2022 and a decrease 0.9 per cent compared to January 2023.
- The average sale price for a townhouse was $642,777. This represents a 25.6 per cent decrease from February 2022 and an increase of 2.7 per cent compared to January 2023.
- The average sale price for an apartment-style condominium was $461,322. This represents a decrease of 19.2 per cent from February 2022 and a decrease of 6.9 per cent compared to January 2023.
- The average sale price for a semi was $667,250. This represents a decrease of 25.8 per cent compared to February 2022 and an increase of 2.6 per cent compared to January 2023.

| MLS® Home Price Index Benchmark Price | ||||||
| Kitchener-Waterloo | Cambridge | |||||
| Benchmark Type: | February 2023 | Monthly % Change | Yr./Yr. % Change | February 2023 | Monthly % Change | Yr./Yr. % Change |
| Composite | $726,500 | 3.0 | -24.2 | $742,300 | 1.6 | -25.3 |
| Detached | $822,800 | 4.2 | -24.8 | $770,800 | 1.8 | -27.0 |
| Townhouse | $588,500 | 0.9 | -22.3 | $637,400 | -0.2 | -13.8 |
| Apartment | $473,800 | -1.6 | -14.3 | $492,100 | 0.9 | -7.6 |

Limited supply and the small number of listings coming to the market continues to be a trend within the region. There may be some hesitation for those considering selling their property due to decreased reported sale prices; however, with demand continuing to outpace supply and prices stabilizing, sellers are in a healthy position to make their move coming into a spring market.
Although prices have fallen more than 20 per cent from their peak in February 2022, they remain significantly higher than three years ago, which is great news for our local market.
There were 671 new listings added last month, a decrease of 37.1 per cent compared to February of last year and a 24.8 per cent decrease compared to the previous ten-year average for February.
The total number of homes available for sale in active status at the end of February was 692, an increase of 75.2 per cent compared to February of last year and 38.0 per cent below the previous ten-year average of 1117 listings for February.
The number of months of inventory is up 140.0 per cent compared to February of last year, but still historically low at 1.2 months. The number of months of inventory represents how long it would take to sell off current inventories at the current sales rate.
The average number of days to sell in February was 20, compared to 8 days in February 2022. The previous 5-year average is 16 days.
Average Sales Price – Municipality

Average Sales Price – Township

Monthly Sales By Property Type

Monthly Supply of Homes for Sale

Monthly Median Sales Price – By Property Type

Monthly Average Sales Price – By Property Type

Monthly Average Days on Market

The Real Estate market is changing very quickly, so If you are thinking of buying or selling this spring, wondering what the neighbor’s place sold for, or have any questions at all, give me a call, text at 519-497-4646 or shoot me an email to kevinbakerrealestate@gmail.com
Enjoy a wonderful March with your families!
Kevin
Condo Prices and Sales Continue to fall in Kitchener Waterloo
I hope you and your family are doing well and enjoying the beautiful August weather we are having. Hopefully if you are in town you have also been able to enjoy some wonderful free music at the Kitchener Blues Festival going on all weekend!
The Stats are out for July and things are still trending up on available homes for sale and trending down on average prices throughout the region. The stress of increasing mortgage rates are putting more pressure on the consumers ability to purchase a home which keeps prices from finding a bottom at this point.
There were 550 residential homes were sold in July, a decrease of 32.8 per cent compared to July 2021, and 32.3 per cent below the previous 5-year average for the month. We’re seeing a clear shift in the market and what people can afford to purchase or are willing to pay. On the bright side for buyers, it’s not the extreme sellers’ market it was.
Total residential sales in July included 337 detached (down 30.4 per cent from July 2021), and 112 townhouses (down 32.9 per cent). Sales also included 65 condominium units (down 39.3 per cent) and 36 semi-detached homes (down 41.0 per cent).
In July, the average sale price for all residential properties in Waterloo Region was $752,301. This represents a 1.2 per cent decrease compared to July 2021 and a 4.9 per cent decrease compared to June 2022.
- The average price of a detached home was $842,241. This represents a 6.0 per cent decrease from July 2021 and a decrease of 7.0 per cent compared to June 2022.
- The average sale price for a townhouse was $642,750. This represents a 3.6 per cent increase from July 2021 and a decrease of 3.3 per cent compared to June 2022.
- The average sale price for an apartment-style condominium was $521,731. This represents an increase of 20.4 per cent from July 2021 and an increase of 4.1 per cent compared to June 2022.
- The average sale price for a semi was $661,087. This represents an increase of 1.0 per cent compared to July 2021 and a decrease of 5.4 per cent compared to June 2022.

| MLS® Home Price Index Benchmark Price | ||||||
| Kitchener-Waterloo | Cambridge | |||||
| Benchmark Type: | July 2022 | Monthly % Change | Yr./Yr. % Change | July 2022 | Monthly % Change | Yr./Yr. % Change |
| Composite | $749,000 | -5.3 | 1.1 | $776,900 | -3.9 | 3.4 |
| Detached | $827,100 | -5.6 | -0.8 | $789,600 | -4.2 | 1.3 |
| Townhouse | $642,500 | -5.1 | 10.5 | $760,500 | -2.6 | 17.7 |
| Apartment | $524,800 | -2.3 | 17.4 | $584,700 | -0.0 | 20.1 |

The real estate market is cooling across the province, and we are seeing significantly fewer buyers from the GTA, which is also impacting prices, however, this is not entirely bad news since the previous market was not sustainable. The surprising thing is we are seeing rents continue to rise. The demad for rental properties has increased which is putting pressure there as well.
There were 1,174 new listings added last month, an increase of 34.0 per cent compared to July of last year, and a 9.2 per cent increase compared to the previous ten-year average for July.
The total number of homes available for sale in active status at the end of July was 1,283, an increase of 215.2 per cent compared to July of last year, and 19.5 per cent below the previous ten-year average of 1593 listings for July.
The number of months of inventory was 1.7 months in July, as it was in June. While this is still at historic lows, the last time it was near this range was September of 2019 when it was 1.6 months. The number of months of inventory represents how long it would take to sell off current inventories at the current sales rate.
The average number of days to sell in July was 18, compared to 11 days in July 2021. The previous 5-year average is 17 days.
Average Sales Price – Municipality

Average Sales Price – Township

Monthly Sales By Property Type

Monthly Supply of Homes for Sale

Monthly Median Sales Price – By Property Type

Monthly Average Sales Price – By Property Type

Monthly Average Days on Market

If you are thinking of buying or selling this summer and fall, wondering what the neighbor’s place sold for, or have any questions at all, give me a call, text at 519-497-4646 or shoot me an email to kevinbakerrealestate@gmail.com
Enjoy the nice weather and have a great rest of the summer!
Kevin
Inventory is tight in Kitchener Waterloo Condo market
I hope you and your family are enjoying the last few days of summer before back to school starts. The weather the past week has been beautiful and I bet the kids must be so excited to be back with their friends again.
I thought with fall approaching you would like a quick update on the Waterloo region housing market. A total of 535 residential homes sold last month, a decrease of 22.1 per cent compared to last August’s record-smashing month, and a decrease of 12.3 per cent compared to July.
While sales were down relative to last month and last August, they remained well above average. The main reason for the decrease is simply that last month was the first full month in Step 3 of the reopening, and people are tired of being locked down. They got out and enjoyed their summer and shifted their real estate needs to the back burner for a much-needed change of focus.
Total residential sales in August included 299 detached (down 30.6 per cent from August 2020), and 80 condominium units (down 1.2 per cent). Sales also included 38 semi-detached homes (down 2.6) and 118 townhouses (down 13.2 per cent).
In August, the average sale price for all residential properties in the Kitchener-Waterloo area was $753,296. This represents a 19.3 per cent increase over August 2020 and a 0.3 per cent decrease compared to July 2021.
- The average price of a detached home was $895,756. This represents a 22.5 per cent increase from August 2020 and a decrease of 1.3 per cent compared to July 2021.
- The average sale price for an apartment-style condominium was $445,280. This represents an increase of 18.2 per cent from August 2020 and an increase of 3.7 per cent compared to July 2021.
- The average sale price for a townhouse was $623,767. This represents a 26.1 per cent increase from August 2020 and an increase of 0.1 per cent compared to July 2021.
- The average sale price for a semi was $683,048. This represents an increase of 26.5 per cent compared to August 2020 and an increase of 2.3 per cent compared to July 2021.

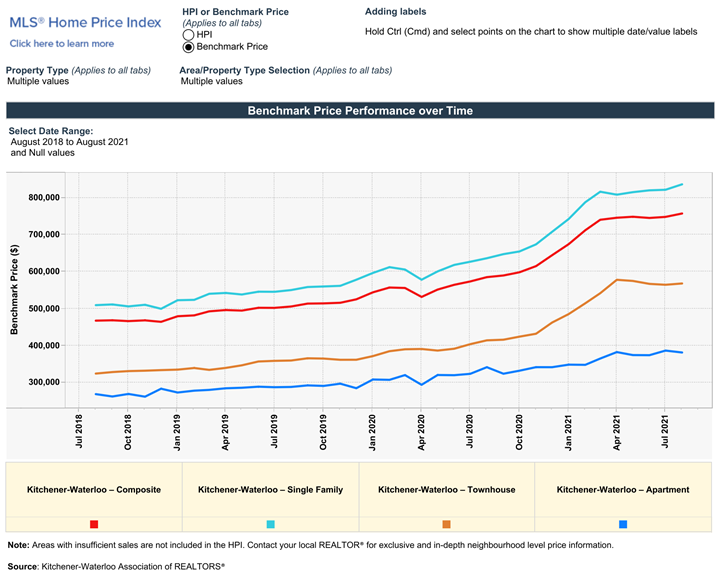
The MLS® HPI composite benchmark price for all residential properties in Kitchener-Waterloo was $757,900 in August. This represents a 29.5 per cent increase over August 2020 and a 1.2 per cent increase compared to July 2021.
- The benchmark price for a detached home was $837,100. This represents a 31.5 per cent increase from August 2020 and 1.8 per cent increase compared to July 2021.
- The benchmark price for an apartment-style condominium was $380,700. This represents a 11.7 per cent increase from August 2020 and a 1.3 per cent decrease compared to July 2021.
- The benchmark price for a townhouse is $568,000. This represents a 37.3 per cent increase from August 2020 and a 0.6 per cent increase compared to July 2021.
There were 590 new listings added to the MLS® System in KW and area last month, a decrease of 27.6 per cent compared to August of last year, and a 13 per cent decrease compared to the previous ten-year average for August.
The total number of homes available for sale in active status at the end of August was 255, a decrease of 53.6 per cent compared to August of last year, and 79.5 per cent below the previous ten-year average of 1,252 listings for August.
The number of homes coming to market continues to be overwhelmed by the number of homebuyers we have wanting to purchase in Waterloo Region.
The number of months of inventory persisted from the July level of 0.4 months in August. Inventory has numbered less than 1 month since October. The number of months of inventory represents how long it would take to sell off current inventories at the current rate of sales.
The average number of days to sell in August was 12 days, compared to 17 days in August 2020 and a previous 5-year average of 26 days.
If you are thinking of buying or selling in the coming months, wonder what the neighbor sold for, or have any questions at all, give me a call, text at 519-497-4646 or shoot me an email to kevinbaker@kwhometeam.ca.
Have a wonderful rest of the long weekend and stay safe!
Kevin
