
The Trend Continues for Condos Prices here in Waterloo Region
I hope you and your family are doing well. The kids are back in school and fall seems to be here. Thanksgiving is next weekend and Halloween will be here before we know it.
I wanted to give you a quick update on the housing numbers for last month. A total of 506 residential homes sold last month, a decrease of 32.1 per cent compared to last September and a decrease of 5.9 per cent compared to August. While the total number of homes sold last month was down considerably compared to last September, it can still be considered an above average month of activity when we remember that last September smashed any previous September for number of sales. In fact, I would say we are on track for setting a record number of annual sales in 2021.
Total residential sales in September included 267 detached (down 37.3 per cent from September 2020), and 83 condominium units (down 11.7 per cent). Sales also included 41 semi-detached homes (down 21.2) and 115 townhouses (down 33.5 per cent).
In September, the average sale price for all residential properties in the Kitchener-Waterloo area was $792,599. This represents a 24.2 per cent increase over September 2020 and a 5.7 per cent increase compared to August 2021.
- The average price of a detached home was $963,646. This represents a 24.9 per cent increase from September 2020 and an increase of 7.9 per cent compared to August 2021.
- The average sale price for an apartment-style condominium was $497,949. This represents an increase of 28.6 per cent from September 2020 and an increase of 12.4 per cent compared to August 2021.
- The average sale price for a townhouse was $646,026. This represents a 35.7 per cent increase from September 2020 and an increase of 3.7 per cent compared to August 2021.
- The average sale price for a semi was $686,316. This represents an increase of 26.1 per cent compared to September 2020 and an increase of 0.5 per cent compared to August 2021.

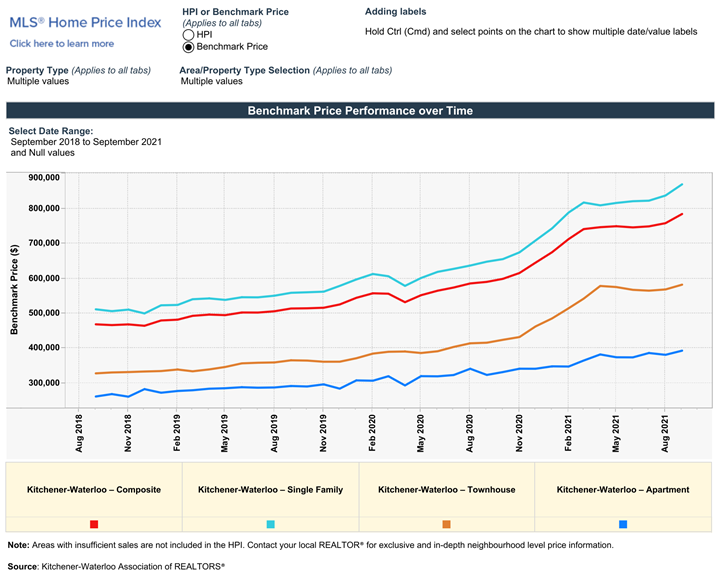
The MLS® HPI composite benchmark price for all residential properties in Kitchener-Waterloo was $784,200 in September. This represents a 33.0 per cent increase over September 2020 and a 3.5 per cent increase compared to August 2021.
- The benchmark price for a detached home was $869,220. This represents a 34.2 per cent increase from September 2020 and 3.8 per cent increase compared to August 2021.
- The benchmark price for an apartment-style condominium was $392,600. This represents a 21.5 per cent increase from September 2020 and a 3.1 per cent increase compared to August 2021.
- The benchmark price for a townhouse is $581,700. This represents a 40.0 per cent increase from September 2020 and a 2.4 per cent increase compared to August 2021.
There were 698 new listings added last month, a decrease of 23.4 per cent compared to September of last year, and a 13 per cent decrease compared to the previous ten-year average for September.
The total number of homes available for sale in active status at the end of September was 345, a decrease of 35.3 per cent compared to September of last year, and 73.2 per cent below the previous ten-year average of 1,285 listings for September.
Home prices reached all new highs in September, and while there is a growing call to add more transparency to how real estate is traded in Ontario —the brutal reality of this market is that supply is simply not keeping up with demand and that is what is driving up prices.
The number of months of inventory nudged up slightly from August’s 0.4 months to half a month in September. Inventory has settled at under 1 month for the past 11 consecutive months. The number of months of inventory represents how long it would take to sell off current inventories at the current rate of sales.
If you are thinking of buying or selling in the coming months, wonder what the neighbor sold for, or have any questions at all, give me a call, text at 519-497-4646 or shoot me an email to kevinbaker@kwhometeam.ca.
Have a wonderful rest of your week and Happy Thanksgiving!
Kevin
Inventory is tight in Kitchener Waterloo Condo market
I hope you and your family are enjoying the last few days of summer before back to school starts. The weather the past week has been beautiful and I bet the kids must be so excited to be back with their friends again.
I thought with fall approaching you would like a quick update on the Waterloo region housing market. A total of 535 residential homes sold last month, a decrease of 22.1 per cent compared to last August’s record-smashing month, and a decrease of 12.3 per cent compared to July.
While sales were down relative to last month and last August, they remained well above average. The main reason for the decrease is simply that last month was the first full month in Step 3 of the reopening, and people are tired of being locked down. They got out and enjoyed their summer and shifted their real estate needs to the back burner for a much-needed change of focus.
Total residential sales in August included 299 detached (down 30.6 per cent from August 2020), and 80 condominium units (down 1.2 per cent). Sales also included 38 semi-detached homes (down 2.6) and 118 townhouses (down 13.2 per cent).
In August, the average sale price for all residential properties in the Kitchener-Waterloo area was $753,296. This represents a 19.3 per cent increase over August 2020 and a 0.3 per cent decrease compared to July 2021.
- The average price of a detached home was $895,756. This represents a 22.5 per cent increase from August 2020 and a decrease of 1.3 per cent compared to July 2021.
- The average sale price for an apartment-style condominium was $445,280. This represents an increase of 18.2 per cent from August 2020 and an increase of 3.7 per cent compared to July 2021.
- The average sale price for a townhouse was $623,767. This represents a 26.1 per cent increase from August 2020 and an increase of 0.1 per cent compared to July 2021.
- The average sale price for a semi was $683,048. This represents an increase of 26.5 per cent compared to August 2020 and an increase of 2.3 per cent compared to July 2021.
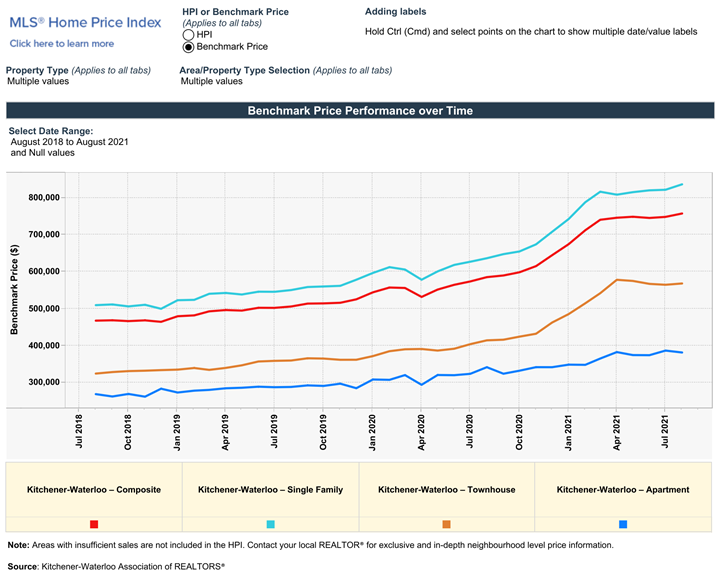
The MLS® HPI composite benchmark price for all residential properties in Kitchener-Waterloo was $757,900 in August. This represents a 29.5 per cent increase over August 2020 and a 1.2 per cent increase compared to July 2021.
- The benchmark price for a detached home was $837,100. This represents a 31.5 per cent increase from August 2020 and 1.8 per cent increase compared to July 2021.
- The benchmark price for an apartment-style condominium was $380,700. This represents a 11.7 per cent increase from August 2020 and a 1.3 per cent decrease compared to July 2021.
- The benchmark price for a townhouse is $568,000. This represents a 37.3 per cent increase from August 2020 and a 0.6 per cent increase compared to July 2021.
There were 590 new listings added to the MLS® System in KW and area last month, a decrease of 27.6 per cent compared to August of last year, and a 13 per cent decrease compared to the previous ten-year average for August.
The total number of homes available for sale in active status at the end of August was 255, a decrease of 53.6 per cent compared to August of last year, and 79.5 per cent below the previous ten-year average of 1,252 listings for August.
The number of homes coming to market continues to be overwhelmed by the number of homebuyers we have wanting to purchase in Waterloo Region.
The number of months of inventory persisted from the July level of 0.4 months in August. Inventory has numbered less than 1 month since October. The number of months of inventory represents how long it would take to sell off current inventories at the current rate of sales.
The average number of days to sell in August was 12 days, compared to 17 days in August 2020 and a previous 5-year average of 26 days.
If you are thinking of buying or selling in the coming months, wonder what the neighbor sold for, or have any questions at all, give me a call, text at 519-497-4646 or shoot me an email to kevinbaker@kwhometeam.ca.
Have a wonderful rest of the long weekend and stay safe!
Kevin
Condo sales continue to hum along in waterloo region
Hope you and your family are enjoing your summer. The weather this weekend has been beautiful so i hope you have been able to get out and enjoy it.
The Real estate market here in Waterloo region continues to show incredible strength with low invetory and strong demand which is keeping prices humming in July.
The was a total of 611 residential homes sold last month, a decrease of 17 per cent compared to the record-setting results of July 2020, but still an above-average number of sales for the month of July.
Total residential sales in July included 339 detached (down 27.1 per cent from July 2020), and 91 condominium units (up 30 per cent). Sales also included 46 semi-detached homes (down 4.2) and 135 townhouses (down 11.8 per cent).
In July, the average sale price for all residential properties in the Kitchener-Waterloo area was $755,681. This represents a 18.2 per cent increase over July 2020 and a 0.6 per cent decrease compared to June 2021.
- The average price of a detached home was $907,192. This represents a 21.9 per cent increase from July 2020 and a decrease of 1.4 per cent compared to June 2021.
- The average sale price for an apartment-style condominium was $429,630. This represents an increase of 6.7 per cent from July 2020 and a decrease of 3.6 per cent compared to June 2021.
- The average sale price for a townhouse was $623,732. This represents a 33.8 per cent increase from July 2020 and an increase of 5.4 per cent compared to June 2021.
- The average sale price for a semi was $667,570. This represents an increase of 28.6 per cent compared to July 2020 and an increase of 2.9 per cent compared to June 2021.

The MLS® HPI composite benchmark price for all residential properties in Kitchener-Waterloo was $748,700 in July. This represents a 30.5 per cent increase over July 2020 and a 0.4 per cent increase compared to June 2021.
- The benchmark price for a detached home was $822,300. This represents a 31.1 per cent increase from July 2020 and 0.2 per cent increase compared to June 2021.
- The benchmark price for an apartment-style condominium was $385,900. This represents a 19.5 per cent increase from July 2020 and a 3.3 per cent increase compared to June 2021.
- The benchmark price for a townhouse is $564,500. This represents a 40 per cent increase from July 2020 and a 0.4 per cent decrease compared to June 2021.

The housing market took a bit of a breather last month and July is typically a quieter month with families taking vacation, and with the region coming out of lockdown there were certainly more staycations happening. But we do anticipate the market will pick up steam again and it will be another busy fall.
There were 675 new listings added to the MLS® System in KW and area last month, a decrease of 24 per cent compared to July of last year, and a 14.4 per cent decrease compared to the previous ten-year average for July.
The total number of homes available for sale in active status at the end of July was 281, a decrease of 52.7 per cent compared to July of last year, and 79.1 per cent below the previous ten-year average of 1,346 listings for July.
The number of months of inventory was 0.4 in July, a decline from 0.5 months in June. Inventory has numbered less than 1 month since October. The number of months of inventory represents how long it would take to sell off current inventories at the current rate of sales.
The average number of days to sell in July was 11 days, compared to 17 days in July 2020 and a previous 5-year average of 22 days.
Historical Sales By Property Type

Months Supply of Homes for Sale

Historical Median Sales Price – By Property Type

Historical Average Sales Price – By Property Type


If you are thinking of buying or selling in the coming months, wonder what the neighbor sold for, or have any questions at all, give me a call, text at 519-497-4646 or shoot me an email to kevinbaker@kwhometeam.ca.
Have a wonderful rest of the weekend and stay safe!
Kevin
Condo Sales Continue To Smash Records in Waterloo Region
Hope you and your family have been doing well. The weather this weekend has been beautiful so i hope you have been able to get out and enjoy it
As for the Real estate market it is still going exceptionally strong and we continue to smash records.
Lets look at the stats…
Strong home sales continued in May once again posted a record-setting number of monthly home sales. There were 854 residential homes sold, an increase of 100.9 per cent compared to May 2020, and a 0.9 per cent increase compared to April 2021.
While last May home sales were restrained due to the pandemic, May 2021 was another extraordinary month of home buying and selling activity. Prior to 2020, the previous 10-year average number of residential sales for May was 656.
Total residential sales in May included 485 detached (up 85.8 per cent from May 2020), and 106 condominium units (up 152.4 per cent). Sales also included 74 semi-detached homes (up 72.1 per cent) and 188 townhouses (up 138 per cent).
In May, the average sale price for all residential properties in the Kitchener-Waterloo area was $740,103. This represents a 30.4 per cent increase over May 2020 and a 2.4 per cent decrease compared to April 2021.
- The average price of a detached home was $868,990. This represents a 32.6 per cent increase from May 2020 and a decrease of 3.4 per cent compared to April 2021.
- The average sale price for an apartment-style condominium was $457,935. This represents an increase of 38.6 per cent from May 2020 and an increase of 3.1 per cent compared to April 2021.
- The average sale price for a townhouse was $601,987. This represents a 33.7 per cent increase from May 2020 and a decrease of 1.8 per cent compared to April 2021.
- The average sale price for a semi was $659,975. This represents an increase of 36.8 per cent compared to May 2020 and an increase of 1.2 per cent compared to April 2021.
Last month the market took a breath and calmed a bit, but there is still very strong demand throughout our region. This started prior to the new mortgage stress test that came into effect on June 1. While these changes will impact the affordability for some, I do not expect it to be very impactful due to the sheer number of buyers in our market.
Average Sales Price – By Property Type

The MLS® HPI composite benchmark price for all residential properties in Kitchener-Waterloo was $749,100 in May. This represents a 35.8 per cent increase over May 2020 and a 0.4 per cent increase compared to April 2021.
- The benchmark price for a detached home was $815,800. This represents a 35.8 per cent increase from May 2020 and 0.8 per cent decrease compared to April 2021.
- The benchmark price for an apartment-style condominium was $373,700. This represents a 16.9 per cent increase from May 2020 and a 2.1 per cent decrease compared to April 2021.
- The benchmark price for a townhouse is $574,900. This represents a 49 per cent increase from May 2020 and a 0.5 per cent decrease compared to April 2021.

There were 1,061 new listings added in KW and area last month, an increase of 83.2 per cent compared to May of last year, and a 2.6 per cent increase compared to the previous ten-year average for May* (*calculated from 2010 to 2019 to adjust for the impact of the state of emergency on activity in May 2020).
The total number of homes available for sale in active status at the end of May was 448, a decrease of 20 per cent compared to May of last year, and 70.5 per cent below the previous ten-year average of 1,520 listings for May* (*calculated from 2010 to 2019 to adjust for the impact of the state of emergency on activity in May 2020).
The number of months of inventory was 0.7 in May, which is unchanged from April. Inventory has numbered less than 1 month since October. The number of months of inventory represents how long it would take to sell off current inventories at the current rate of sales.
The average number of days to sell in May was 9 days, compared to 21 days in May 2020 and a previous 5-year average of 20 days.
If you are thinking of buying or selling in the coming months, wonder what the neighbor sold for, or have any questions at all, give me a call, text at 519-497-4646 or shoot me an email to kevinbaker@kwhometeam.ca.
Have a wonderful rest of the weekend and stay safe!
Kevin
Historical Sales By Property Type

Months Supply of Homes for Sale

Historical Median Sales Price – By Property Type

Historical Average Sales Price – By Property Type


April had 2nd Highest Sales on Record for Waterloo Region
Hope you and your family have been doing well. How are you surviving the lockdown? Personally this whole covid thing is getting a little old and I wish things could just go back to normal as i am sure you do too.
As for the Real estate market it is still going exceptionally strong and we had the 2nd highest sales on record for April!
Lets look at the stats…
Following last month’s record-smashing number of home sales, we posted the second-highest number of monthly home sales in April. There were 843 residential homes sold, an increase of 263.4 per cent compared to April 2020, and a decrease of 15.5 per cent compared to March 2021.
Even if we do not take into account April 2020, when Ontario was in the early days of its state of emergency, it was still an exceptional number of homes sold last month. The previous 10-year average number of residential sales for April was 618.
Total residential sales in April included 484 detached (up 233.8 per cent from April 2020), and 111 condominium units (up 382.6 per cent). Sales also included 67 semi-detached homes (up 294.1 per cent) and 181 townhouses (up 285.1 per cent).
In April, the average sale price for all residential properties in the Kitchener-Waterloo area was $757,906. This represents a 34.3 per cent increase over April 2020 and a 0.9 per cent decrease compared to March 2021.
- The average price of a detached home was $899,315. This represents a 36.9 per cent increase from April 2020 and an increase of 0.04 per cent compared to March 2021.
- The average sale price for an apartment-style condominium was $441,887. This represents an increase of 21.2 per cent from April 2020 and an increase of 4.2 per cent compared to March 2021.
- The average sale price for a townhouse was $612,550. This represents a 52.1 per cent increase from April 2020 and a decrease of 2.03 per cent compared to March 2021.
- The average sale price for a semi was $652,609. This represents an increase of 33.0 per cent compared to April 2020 and an increase of 0.18 per cent compared to March 2021.
We are starting to see home prices calm down in March and April compared to what was happening in January and February which is great news for buyers.

The MLS® HPI composite benchmark price for all residential properties in Kitchener-Waterloo was $742,800 in April. This represents a 40.4 per cent increase over April 2020 and a 0.6 per cent increase compared to March 2021.
- The benchmark price for a detached home was $809,000. This represents a 39.9 per cent increase from April 2020 and 1.0 per cent decrease compared to March 2021.

There were 1,098 new listings last month, an increase of 162.7 per cent compared to April of last year, and a 17.15 per cent increase compared to the previous ten-year average for April* (*calculated from 2019 to 2010 to adjust for the impact of the state of emergency on activity in April 2020).
The total number of homes available for sale in active status at the end of April was 458, a decrease of 21.8 per cent compared to April of last year, and 66.9 per cent below the previous ten-year average of 1,384 listings for April* (*calculated from 2010 to 2019 to adjust for the impact of the state of emergency on activity in April 2020).
The number of months of inventory was 0.7 in April, which is unchanged from March. Inventory has numbered less than 1 month since October. The number of months of inventory represents how long it would take to sell off current inventories at the current rate of sales.
The average number of days to sell in April was 9 days, compared to 19 days in April 2020 and a previous 5-year average of 21 days.
If you are thinking of buying or selling in the coming months, wonder what the neighbor sold for, or have any questions at all, give me a call, text at 519-497-4646 or shoot me an email to kevinbaker@kwhometeam.ca.
Have a wonderful weekend and stay safe!
Kevin
Historical Sales By Property Type

Months Supply of Homes for Sale

Historical Median Sales Price – By Property Type

Historical Average Sales Price – By Property Type


Record Breaking Home and Condo Sales in Waterloo Region
Hope you and your family have been doing well and everyone is staying safe. Unfortunatley lockdowns are back for the next 4 weeks so i hope that things will get back to some kind of normal at some point this year.
As for the Real estate market it is still going exceptionally strong and we broke a total sales record in March! Even though everyone is saying there is no inventory that is not the case. There is lots of inventory but the buyers still out number the sellers with all the GTA buyers coming to scoop up properties.
Lets look at the stats from March…
March posted the highest number of monthly home sales in the board’s history. There were 993 residential homes sold, an increase of 72.7 per cent compared to March 2020, and an increase of 66 per cent compared to the previous month. The previous 10-year average number of residential sales for March is 552.
Total residential sales in March included 593 detached (up 69.4 per cent from March 2020), and 124 condominium units (up 82.4 per cent). Sales also included 79 semi-detached homes (up 216 per cent) and 197 townhouses (up 49.2 per cent).
In March, the average sale price for all residential properties in the Kitchener-Waterloo area was $765,393. This represents a 30.8 per cent increase over March 2020, and a 1.5 per cent increase compared to February 2021.
- The average price of a detached home was $899,460. This represents a 32.3 per cent increase from March 2020, and a decrease of 1.4 per cent compared to February 2021.
- The average sale price for an apartment-style condominium was $423,470. This represents an increase of 12 per cent from March 2020, and an increase of 1.6 per cent compared to February 2021.
- The average sale price for a townhouse was $622,258. This represents a 35.9 per cent increase from March 2020, and an increase of 2 per cent compared to February 2021.
- The average sale price for a semi was $652,669. This represents an increase of 32.5 per cent compared to March 2020, and a decrease of 4.8 per cent compared to February 2021.
On a year-over-year basis we continued to see huge price increases in the average price in March, however compared to February we are seeing some signs that perhaps prices may be starting to stabilize a bit.
The MLS® HPI composite benchmark price for all residential properties in Kitchener-Waterloo was $738,200 in March. This represents a 33.4 per cent increase over March 2020 and a 4 per cent increase compared to February 2021.
- The benchmark price for a detached home was $817,000. This represents a 34.4 per cent increase from March 2020 and 3.6 per cent increase compared to February 2021.
- The benchmark price for an apartment-style condominium was $358,700. This represents a 14.9 per cent increase from March 2020 and a 5.1 per cent increase compared to February 2021.
- The benchmark price for a townhouse is $554,900. This represents a 38.3 per cent increase from March 2020 and a 5.4 per cent increase compared to February 2021.
In addition to the record number of sales in March, we also had a record number of newly listed properties come on the market. The number of new listings last month was the most of any month, and the highest number since May of 2017 when there were 1,271 new listings.
There were 1,359 new listings added to the MLS® System in KW and area last month, an increase of 56.2 per cent compared to March of last year, and a 63.9 per cent increase compared to the previous ten-year average for March.
The total number of homes available for sale in active status at the end of March was 434, a decrease of 23.5 per cent compared to March of last year, and 63.5 per cent below the previous ten-year average of 1,188 listings for March.
The number of months of inventory was 0.7 in March and has numbered less than 1 month since October. The number of months of inventory represents how long it would take to sell off current inventories at the current rate of sales.
The average number of days to sell in March was 8 days, compared to 16 days in March 2020 and a previous 5-year average of 21 days.
Historical Sales By Property Type

Months Supply of Homes for Sale

Historical Median Sales Price – By Property Type

Historical Average Sales Price – By Property Type


If you are thinking of buying or selling in the coming months, wonder what the neighbor sold for, or have any questions at all, give me a call, text at 519-497-4646 or shoot me an email to kevinbaker@kwhometeam.ca.
Have a wonderful weekend and stay safe!
Kevin
It Was a Crazy Real Estate Market in Waterloo Region in January!!
Hope you and your family have been doing well and everyone is staying safe. With the lockdowns in place and the kids home from school it is definitely a different winter season indeed. There is some great news though… the Waterloo Region real estate market is still on FIRE! The average price of a detached home in the region hits a new milstone… Breaking $800,000… WOW!!!
There were 351 residential homes sold in January, an increase of 24.9 per cent compared to January 2020, and an increase of 1.4 per cent compared to the previous month. The previous 10-year average number of residential sales for January is 286.
Total residential sales in January included 201 detached (up 31.3 per cent from January 2020), and 71 condominium units (up 97 per cent). Sales also included 21 semi-detached homes (unchanged) and 56 freehold townhouses (down 17.6 per cent).
In January, the average sale price of all residential properties sold in 2021 increased by 23.9 per cent to $695,582 compared to the same month last year. Meanwhile, the average price of a detached home hit a new milestone by exceeding 800-thousand-dollars for the first time, coming in at $853,945 an increase of 27.3 per cent. During this same period, the average sale price for an apartment-style condominium was $383,196 for a decrease of 1.4 per cent. Townhomes and semis sold for an average of $566,345 (up 29 per cent) and $626,512 (up 29.3 per cent) respectively.
The median price of all residential properties sold in January increased 25.9 per cent to $680,000 and the median price of a detached home during the same period increased 23.3 per cent to $801,500.
With demand for homes in the region very strong, the consumer preference is leaning predominantly toward single detached homes. In January we saw buyers paying a premium for this property type, Conversely, even as condo sales were increasing in January, we saw prices for this style of housing soften by comparison.
Supply is just not able to keep up with continuing demand, much of it coming from the GTA, for the strong increases in home prices in Waterloo Region and in many other parts across the province. The number of months of inventory in Waterloo region has numbered less than 1 month since October. The number of months of inventory represents how long it would take to sell off current inventories at the current rate of sales.
There were 432 new listings added to the MLS® System in KW and area last month, a decrease of 7.4 per cent compared to January of last year, and 37.6 per cent decrease compared to the previous ten-year average for January.
The average number of days to sell in January was 16 days, compared to 22 days in January 2020 and a previous 5-year average of 30 days

If you are thinking of buying or selling in the coming months, wonder what the neighbor sold for, or have any questions at all, give me a call, text at 519-497-4646 or shoot me an email to kevinbaker@kwhometeam.ca.
Have a wonderful weekend and stay safe!
Kevin
Recap of 2020 Home and Condo market in Waterloo region.
How was your Christmas and New years? Mother nature was nice enough to give us a white christmas and since then we have had some great weather to get outside and do some hiking or other winter activites. I know with covid it was a very different year for all of us but i trust you were able to get some time with family and friends in some form.
The stats are out and thought i would share them to keep you up to date on our crazy housing market. It was a year of fast paced upward movement in home and condo prices here in Waterloo Region. Have a look below to see the stats….
There were 6,492 residential homes sold in 2020, an increase of 9 per cent compared to 2019. Compared to previous years, 2020’s annual sales were 5 per cent above the previous 5-year average, and 11.6 per cent above the previous 10-year average.
On a monthly basis, there were 42 per cent more home sales compared to last year, with 351 home sales in the month of December.
December’s home sales were the highest on record for the month. This marks the sixth consecutive month of record home sales in Kitchener-Waterloo and helps propel 2020’s annual number of transactions over the 6,000-unit threshold for only the third time in our history.
Total residential sales in December included 204 detached (up 46.7 per cent), and 63 condominium units (up 34 per cent) which includes any property regardless of style (i.e., semis, townhomes, apartment, detached etc.). Sales also included 20 semi-detached homes (down 9.1 per cent) and 64 freehold townhouses (up 68.4 per cent).
For 2020, total residential sales included 3,899 detached (up 8.1 per cent), and 804 condominium units (up 18.9 per cent) which includes any property regardless of style (i.e., semis, townhomes, apartment, detached etc.). Sales also included 450 semi-detached homes (up 6.8 per cent) and 1,346 freehold townhouses (up 7 per cent).
In December, the average sale price of all residential properties sold in 2020 increased by 14.4 per cent to $634,545 compared to 2019. Detached homes sold for an average price of $755,618 an increase of 11.9 per cent compared to 2019. During this same period, the average sale price for an apartment-style condominium was $383,196 for an increase of 5.4 per cent. Townhomes and semis sold for an average of $514,760 (up 27.7 per cent) and $574,659 (up 20.2 per cent) respectively.
On a year-to-date basis, the average sale price of all residential properties sold in 2020 increased by 16.1 per cent to $612,521 compared to 2019. Detached homes sold for an average price of $719,203 an increase of 16.9 per cent compared to 2019. During this same period, the average sale price for an apartment-style condominium was $391,698 for an increase of 13.7 per cent. Townhomes and semis sold for an average of $468,891 (up 14.6 per cent) and $520,753 (up 18.3 per cent) respectively.
The median price of all residential properties sold last year increased 17.3 per cent to $575,000 and the median price of a detached home during the same period increased 15.7 per cent to $660,000.
With more people working from home, some permanently, space has become a greater concern than ever before. When you combine this with all the other great attributes of our region, it is no surprise that Waterloo Region is putting up these kinds of numbers.
Like many other parts of Ontario, low inventory has become a defining factor of Waterloo Region’s housing market and the new normal. The number of months of inventory remained at just 1 month or less throughout most of 2020.
For historical context, the number of months inventory in Kitchener-Waterloo between 2011 and 2015 averaged 4. Between 2016 and 2020 it was a monthly average of 1.5 months. The number of months of inventory represents how long it would take to sell off current inventories at the current rate of sales.
The average number of days to sell in 2020 was 16 days, compared to 23 days in 2019 and a previous 5-year average of 27 days.
Dollar volume of all residential real estate sold last year increased 26.5 per cent to $3.9 billion compared with 2019.
Looking to the year ahead, we should expect more of the same. Real estate continues to be one of the shining lights supporting the Ontario economy, so we do not expect to see any significant efforts to try to cool the market. Buyers should continue to expect stiff competition in Waterloo Region, and for sellers, there will continue to be a strong interest for all properties entering the market.


If you are thinking of buying or selling in the coming months, wonder what the neighbor sold for, or have any questions at all, give me a call, text at 519-497-4646 or shoot me an email to kevinbaker@kwhometeam.ca.
Have a wonderful weekend and stay safe!
Kevin
4th Straight Record Setting Month for Condo Sales in Waterloo Region
Hope you had a great week and are looking forward to the nice weekend weather coming up. Enjoy them while you can as i am sure the snow is coming sooner than we would like.
It was the 4th record month in a row for monthly home sales in Kitchener Waterloo. The market is a very heated sellers market for sure with record prices seeminly coming up everyday.
There were 691 residential homes sold in October, the most ever recorded for the month. October’s home sales represented an increase of 28 per cent compared to the same month last year, and a decrease of 9.6 per cent compared to the previous month. The previous ten-year average number of residential sales for October is 471.
Total residential sales in October included 417 detached homes (up 25.6 per cent from October 2019), and 94 condominium apartments (up 34 per cent). Sales also included 134 townhouses (up 26.4 per cent) and 46 semi-detached homes (up 48.3 per cent).
The average sale price of all residential properties sold in October increased 19.4 per cent to $635,301 compared to the same month last year, while detached homes sold for an average price of $742,596 an increase of 21.7 per cent. During this same period, the average sale price for an apartment-style condominium was $395,627 for an increase of 14.8 per cent. Townhomes and semis sold for an average of $499,641 (up 15.6 per cent) and $539,434 (up 16.6 per cent) respectively.
The median price of all residential properties sold in October increased 19.2 per cent to $595,000 and the median price of a detached home during the same period increased 20.5 per cent to $686,000.
Real Estate continues to be one of the few shining lights to help Ontario’s economy recover from the pandemic. We’re continuing to see more buyers than sellers, including additional buyers migrating here from out of the region looking for the quality of life this region offers.
There were 783 new listings added last month, an increase of 16 per cent compared to October of last year, and 11.5 per cent more than the previous ten-year average for October.
The number of Months Supply (also known as absorption rate) continues to be very low at just 1 month for the month of October. The previous ten-year average supply of homes for October was 3.2 months, and in the past 5 years, the average supply for October was 1.8 months.
I can say unequivocally we are seeing strong demand from GTA buyers. What people want and need in a home, and where they want to be located has been redefined in a very short period. Waterloo region is quite rightly, a highly desirable place to own a home.
The average days to sell in October was 13 days, compared to 23 days in October 2019.

If you are thinking of buying or selling in the coming months, wonder what the neighbor sold for, or have any questions at all, give me a call, text at 519-497-4646 or shoot me an email to kevinbaker@kwhometeam.ca.
Have a wonderful weekend and stay safe!
Kevin
Another Huge Month for Condo Sales in Waterloo Region
Hope you are having a great week and looking forward to the long weekend coming up. It will certainly be a different Thanksgiving for families this year. I hope that are you are able to spend some time quality with them 🙂
The stats are out for September and the market is still incredibly strong!
There were 758 residential homes sold in September, the most ever recorded for the month. September’s home sales represented an increase of 41.6 per cent compared to the same month last year, and an increase of 8 per cent compared to the previous month. The previous ten-year average number of residential sales for September is 460.
This is far more home sales then what we would normally see in September as buyers seem to continue to play catch up from the COVID-19 hindered spring market. While the pandemic has had devastating impacts on many aspects of our lives it has only solidified the importance of home and homeownership.
Total residential sales in September included 431 detached homes (up 28.6 per cent from September 2019), and 93 condominium apartments (up 127 per cent). Sales also included 178 townhouses (up 43.5 per cent) and 54 semi-detached homes (up 59 per cent).
The average sale price of all residential properties sold in September increased 17.5 per cent to $637,691 compared to the same month last year, while detached homes sold for an average price of $768,762 an increase of 25 per cent. During this same period, the average sale price for an apartment-style condominium was $390,690 for an increase of 13 per cent. Townhomes and semis sold for an average of $ 476,636 (up 8.7 per cent) and $544,874 (up 16.5 per cent) respectively.
The median price of all residential properties sold in September increased 13.7 per cent to $580,250 and the median price of a detached home during the same period increased 16.5 per cent to $676,000.
There has been more new listings coming to the market which is fantastic but buyer demand continues to outpace the supply and driving prices up.
There were 929 new listings added last month, an increase of 13 per cent compared to September of last year, and 17.7 per cent more than the previous ten-year average for September.
The number of Months Supply (also known as absorption rate) continues to be very low at just 1 month for the month of September. The previous ten-year average supply of homes for September was 3.3 months, and in the past 5 years, the average supply for September was 2.2 months.
The year-to-date number of residential sales has increased 2.6% over 2019 indicating that the decreased activity in April and May has been more than made up in the past four months.
We are seeing more and more people moving out of the core areas of Kitchener and Waterloo to the suburbs. This has put small pressure on condo sales and increased demand for single detached and townhomes in the region.
The average days to sell in September was 14 days, compared to 23 days in September 2019.

If you are thinking of buying or selling in the coming months, wonder what the neighbor sold for, or have any questions at all, give me a call, text at 519-497-4646 or shoot me an email to kevinbaker@kwhometeam.ca.
Enjoy your Thanksgiving with your families!
Kevin
Another Record Month for Condo Sales in Kitchener Waterloo!
Hope you enjoyed a wonderful long weekend and are ready for the back to school season. Be mindful on the roads in the coming weeks with the little ones out and about.
It was another record setting month for home sales here in Waterloo Region. The market continues to be a serious sellers market with many mulitple offers on properly priced homes and condos. Here are some stats below to bring you up to date.
There were 686 residential homes sold through the Multiple Listing System (MLS® System) in August, the most ever recorded for the month. August’s home sales represented an increase of 48 per cent compared to the same month last year, and a decrease of 8 per cent compared to the previous month. The previous ten-year average number of residential sales for August is 470.
The market has been hot all summer after a slower spring market where most people were observing physical distancing guidelines, sales in August continued to be very active with demand continuing to outstrip supply forcing buyers to act quickly once again.
Total residential sales in August included 433 detached homes (up 61.5 per cent from August 2019), and 79 condominium apartments (up 38.5 per cent). Sales also included 138 townhouses (up 40 per cent) and 39 semi-detached homes (no change).
The average sale price of all residential properties sold in August increased 21 per cent to $634,409 compared to the same month last year, while detached homes sold for an average price of $734,427 an increase of 18.9 per cent. During this same period, the average sale price for an apartment-style condominium was $386,972 for an increase of 16 per cent. Townhomes and semis sold for an average of $495,932 (up 18.3 per cent) and $535,330 (up 21.1 per cent) respectively.
The median price of all residential properties sold in August increased 20.8 per cent to $597,955 and the median price of a detached home during the same period increased 17.4 per cent to $675,000.
There were 833 new listings added to the MLS® System in KW and area last month, an increase of 43.8 per cent compared to August of last year, and 26.4 per cent more than the previous ten-year average for August.
The number of Months Supply (also known as absorption rate) continues to be very low at just 1 month for the month of August. The previous ten-year average supply of homes for August was 3.3 months, and in the past 5 years, the average supply for August was 2.2 months.
The average days to sell in August was 16 days, compared to 26 days in August 2019.
If you are thinking of buying or selling in the coming months, wonder what the neighbor sold for, or have any questions at all, give me a call, text at 519-497-4646 or shoot me an email to kevinbaker@kwhometeam.ca.
Enjoy your September!
Kevin
