
Waterloo Region Condo Sales see’s a Decrease in September
I hope you had a great week and are looking forward to the weekend. The weather has been so nice in September but I am sure fall is just around the corner. The stats are out for September in the Waterloo Region Housing market and Sales were down once again but prices were up slightly. Let’s take a look at the numbers…
In September, a total of 521 homes were sold in the Waterloo Region. This represents a decrease of 2.1 per cent compared to the same period last year and a decline of 23.5 per cent compared to the average number of homes sold in the previous ten years for the same month.
There has been an overall slowdown in home sales, but we continued to see strong demand for detached homes, resulting in an increase in sales for that specific type of property last month. The buyers have a bit more selection than a year ago as inventory is up, and homes take a little longer to sell. This can mean a less stressful homebuying experience, but for sellers, the current market may require more patience or even adjustment in price expectation.
Total residential sales in September included 336 detached homes (up 9.4 per cent from September 2023), and 95 townhouses (down 22.1 per cent). Sales also included 57 condominium units (down 16.2 per cent) and 32 semi-detached homes (down 3.0 per cent).
In September, the average sale price for all residential properties in Waterloo Region was $788,944. This represents a 2.9 per cent increase compared to September 2023 and a 2.3 per cent increase compared to August 2024.
- The average price of a detached home was $910,286. This represents a 2.3 per cent increase from September 2023 and an increase of 2.2 per cent compared to August 2024.
- The average sale price for a townhouse was $595,435. This represents a 6.9 per cent decrease from September 2023 and a decrease of 2.7 per cent compared to August 2024.
- The average sale price for an apartment-style condominium was $483,331. This represents a decrease of 3.4 per cent from September 2023 and an increase of 4.9 per cent compared to August 2024.
- The average sale price for a semi was $654,613. This represents a decrease of 2.9 per cent compared to September 2023 and an increase of 0.1 per cent compared to August 2024.
Average Sale Price – Monthly

| MLS® Home Price Index Benchmark Price | ||||||
| Kitchener-Waterloo | Cambridge | |||||
| Benchmark Type: | September 2024 | Monthly % Change | Yr./Yr. % Change | September 2024 | Monthly % Change | Yr./Yr. % Change |
| Composite | $728,700 | 0.2 | -1.8 | $741,800 | -0.1 | 0.0 |
| Single Family | $844,400 | 0.6 | 0.3 | $777,500 | 0.2 | 1.3 |
| Townhouse | $602,800 | -0.7 | -5.5 | $641,700 | -1.7 | -4.8 |
| Apartment | $435,700 | -1.3 | -8.3 | $481,500 | -0.2 | -4.2 |

In September, the federal government made some policy changes. These changes include extending mortgage terms to 30 years for first-time homebuyers and all buyers of new builds and raising the CMHC insurance cap from $1 million to $1.5 million. These changes will come into effect later this year. Combined with anticipated further interest rate cuts, these adjustments could enable more buyers to purchase their first home.
There were 1,313 new listings added last month, a decrease of 6.5 per cent compared to September last year and a 20.0 per cent increase compared to the previous ten-year average for September.
The total number of homes available for sale in active status at the end of September was 1,751 an increase of 21.3 per cent compared to September of last year and 42.2 per cent above the previous ten-year average of 1,232 listings for September.
The total inventory across the market increased by 23.1 percent, resulting in a 3.2-month supply of all property types by the end of September. Condominium apartments had the highest inventory, with 5.5 months’ supply, followed by townhouses with 3.6 months’ supply and detached homes with 2.7 months’ supply. The number of months of inventory represents the time it would take to sell off current inventories at the current sales rate.
The average time it took to sell a home in September was 28 days, which is three days longer than the previous month. In September 2023, it took 19 days for a home to sell, and the five-year average is 18 days.
If you have any questions at all, are thinking of making a move this fall and wondering what your home might be worth, give me a call or text to 519-497-4646 or shoot me an email to kevinbakerrealestate@gmail.com and we can sit down for a coffee and chat about your family’s needs going forward.
Enjoy your Thanksgiving with your families next weekend!
Kevin
Average Sales Price – Municipality

Average Sales Price – Township

Monthly Sales By Property Type

Monthly Supply of Homes for Sale

Monthly Supply of Homes for Sale – By Property Type

Monthly Median Sales Price – By Property Type

Monthly Average Sales Price – By Property Type

Monthly Average Days on Market

March Home and Condo Sales Slump in March for Kitchener, Waterloo and Cambridge
I hope you had a nice Easter long weekend with the family last week and got to enjoy some time together making new memories. The Easter bunny came to our place too in the form of 4 new chickens and 2 ducks for our newly constructed coop 🙂
The stats for March came out and Waterloo Region experienced record low home sales. The market is tight for inventory once again and multiple offers are showing up for well priced homes in the 700-900k range.
Let’s take a look at the numbers….
In March, a total of 596 homes were sold, this represents a decrease of 3.2% compared to the same period last year and a decline of 33.4% compared to the average number of homes sold in the previous 5 years for the same month.
Despite the challenging market conditions, the first quarter of 2024 saw an increase in home sales, marking an 8.0 per cent rise compared to the previous year. However, these figures still fall short of the first-quarter sales of the past decade.
While home sales in Waterloo Region hit a record low for March in over two decades, we’re also witnessing a positive trend. Over the past three months, prices and activity have started to pick up, and I expect this momentum will continue into the spring.
Total residential sales in March included 344 detached (down 3.9 per cent from March 2023), and 127 townhouses (down 0.8 per cent). Sales also included 86 condominium units (down 1.1 per cent) and 37 semi-detached homes (down 11.9 per cent).
In March, the average sale price for all residential properties in Waterloo Region was $806,279. This represents a 3.6 per cent increase compared to March 2023 and a 6.6 per cent increase compared to February 2024.
- The average price of a detached home was $954,342. This represents a 4.9 per cent increase from March 2023 and an increase of 7.3 per cent compared to February 2024.
- The average sale price for a townhouse was $667,810. This represents a 4.4 per cent increase from March 2023 and an increase of 6.0 per cent compared to February 2024.
- The average sale price for an apartment-style condominium was $483,085. This represents an increase of 0.3 per cent from March 2023 and an increase of 5.3 per cent compared to February 2024.
- The average sale price for a semi was $680,039. This represents a decrease of 2.9 per cent compared to March 2023 and an increase of 1.0 per cent compared to February 2024.
Average Sale Price – Monthly

| MLS® Home Price Index Benchmark Price | ||||||
| Kitchener-Waterloo | Cambridge | |||||
| Benchmark Type: | March 2024 | Monthly % Change | Yr./Yr. % Change | March 2024 | Monthly % Change | Yr./Yr. % Change |
| Composite | $740,900 | 1.6 | 0.0 | $747,500 | 0.7 | 0.9 |
| Detached | $853,800 | 1.5 | 1.3 | $780,100 | 0.8 | 1.1 |
| Townhouse | $614,900 | 2.3 | 1.3 | $652,400 | 0.6 | 2.4 |
| Apartment | $461,900 | 2.1 | -0.7 | $490,500 | 2.8 | 3.4 |

Home prices have been gradually increasing since December, which is a typical trend that we see going into a spring market. The rate and extent of further increases will depend on the willingness and patience of potential home buyers who have been waiting for lower interest rates before making their purchase. With the Bank of Canada not anticipated to make any rate changes before its June meeting, some potential home buyers may feel stuck in limbo.
There were 1,023 new listings added last month, an increase of 18.7 per cent compared to March last year and a 15.9 percent decrease compared to the previous ten-year average for March.
The total number of homes available for sale in active status at the end of March was 1,081 an increase of 54.0 per cent compared to March of last year and 1.1 per cent below the previous ten-year average of 1,093 listings for March.
At the end of March, there were 1.9 months of inventory, a 58.3 percent increase compared to last year and 18.8 percent above the previous 10-year average. The number of months of inventory represents how long it would take to sell off current inventories at the current sales rate.
The average number of days to sell in March was 19, the same number as March 2023. The previous 5-year average was 18 days.
If you are thinking about buying a new home, It is my belief that we are going to see home prices rise throughout 2024 and once the Bank of Canada starts lowering rates the acceleration of prices will increase as buyers that have been sitting on the sidelines will jump back into the market.
If you have any questions at all, are thinking of making a move this spring and wondering what your home might be worth, give me a call or text to 519-497-4646 and we can sit down for a coffee and chat about your family’s needs going forward.
Enjoy the rest of your April and the nice weather that is coming.
Kevin
Average Sales Price – Municipality

Average Sales Price – Township

Monthly Sales By Property Type

Monthly Supply of Homes for Sale

Monthly Supply of Homes for Sale – By Property Type

Monthly Median Sales Price – By Property Type

Monthly Average Sales Price – By Property Type

Monthly Average Days on Market

Condo market softer while the housing market remains steady in Kitchener Waterloo and Cambridge
I hope you are and your family are enjoying the mild winter we have had so far. The ground hogs predicted an early spring, which is not good news for all the skiiers.
The stats are out for the housing market here in Waterloo Region for January. Lets take a look at the numbers.
In January, there were 375 homes sold, representing an increase of 25.4 per cent compared to the previous year and a decline of 7.4 per cent compared to the previous 10-year average for the month.
January is traditionally a slower time of year for home sales, but it’s reassuring to see the increase compared to last year. This time last year, we hit an all-time low in January home sales, and while this year has begun with sales below the historical average, the market is showing signs of improvement.
Total residential sales in January included 206 detached (up 15.7 per cent from January 2023), and 85 townhouses (up 39.3 per cent). Sales also included 56 condominium units (up 30.2 per cent) and 19 semi-detached homes (up 11.8 per cent).
In January, the average sale price for all residential properties in Waterloo Region was $762,174. This represents a 0.1 per cent decrease compared to January 2023 and a 3.2 per cent increase compared to December 2023.
- The average price of a detached home was $911,262. This represents a 2.9 per cent increase from January 2023 and an increase of 7.5 per cent compared to December 2023.
- The average sale price for a townhouse was $638,162. This represents a 2.0 per cent increase from January 2023 and an increase of 2.7 per cent compared to December 2023.
- The average sale price for an apartment-style condominium was $446,146. This represents a decrease of 10.0 per cent from January 2023 and a decrease of 8.7 per cent compared to December 2023.
- The average sale price for a semi was $631,995. This represents a decrease of 2.9 per cent compared to January 2023 and an increase of 3.1 per cent compared to December 2023.
Average Sale Price – Monthly

| MLS® Home Price Index Benchmark Price | ||||||
| Kitchener-Waterloo | Cambridge | |||||
| Benchmark Type: | January 2024 | Monthly % Change | Yr./Yr. % Change | January 2024 | Monthly % Change | Yr./Yr. % Change |
| Composite | $714,600 | 1.3 | 0.1 | $747,800 | 5.8 | 3.8 |
| Detached | $820,700 | 2.8 | 2.6 | $777,900 | 7.0 | 4.3 |
| Townhouse | $597,500 | -0.7 | -0.4 | $658,700 | 0.2 | 3.7 |
| Apartment | $444,000 | -5.9 | -7.3 | $487,100 | -2.2 | 0.2 |

We are optimistic that this year will have more stability than last. With the Bank of Canada holding steady at a 5.0% benchmark interest rate, they recognize the overall economy has slowed down. However, housing is a key metric, and we expect the Bank to maintain a balanced response so long as housing continues with moderate growth in 2024 rather than any dramatic increases.
There was 720 new listings added last month, an increase of 23.5 per cent compared to January last year and a 3.9 per cent decrease compared to the previous ten-year average for January.
The total number of homes available for sale in active status at the end of January was 855 an increase of 33.4 per cent compared to January of last year and 1.2 per cent below the previous ten-year average of 865 listings for January.
At the end of January, there were 1.5 months of inventory, a 50.0 percent increase compared to last year and 15.4 percent above the previous 10-year average. The number of months of inventory represents how long it would take to sell off current inventories at the current sales rate.
With the exception of condo apartment property types, we saw mostly yearly and monthly price gains across the housing types. This is because there is more supply in the condo segment (2.8 months) compared to the other property types.
The average number of days to sell in January was 33, compared to 25 days in January 2023. The previous 5-year average is 20 days.
If you are thinking of making a move in the next couple of months or are just wondering what your neighbors home sold for, please give me a call or text at 519-497-4646 or email kevinbakerrealestate@gmail.com.
Lets sit down for a coffee and talk about your families needs going forward.
Have a wonderful February!
Kevin
Average Sales Price – Municipality

Average Sales Price – Township

Monthly Sales By Property Type

Monthly Supply of Homes for Sale

Monthly Supply of Homes for Sale – By Property Type

Monthly Median Sales Price – By Property Type

Monthly Average Sales Price – By Property Type

Monthly Average Days on Market
Prices and Sales up in Kitchener Waterloo and Cambridge for July
Hope all is well with you and your family. Summer is here and I hope that you have been able to get out and enjoy some of the great weather we have had lately.
The market stats are out for June, lets take a look and see where things are at…
In June, there were 780 homes sold, representing an increase of 4.6 per cent compared to the previous year and a decline of 12.3 per cent compared to the previous 5-year average for the month.
The real estate market in Waterloo Region showed signs of a rebound in June, with monthly sales increasing on a year-over-year basis for the first time this year. The total number of home sales are down nearly 25 per cent for the first half of 2023 compared to last year but have been steadily climbing since January.
Total residential sales in June included 468 detached (up 5.9 per cent from June 2022), and 149 townhouses (up 4.9 per cent). Sales also included 118 condominium units (up 22.9 per cent) and 42 semi-detached homes (down 32.3 per cent).
In June, the average sale price for all residential properties in Waterloo Region was $839,869. This represents a 6.4 per cent increase compared to June 2022 and a 2.0 per cent increase compared to May 2023.
- The average price of a detached home was $1,005,519. This represents a 10.4 per cent increase from June 2022 and an increase of 4.1 per cent compared to May 2023.
- The average sale price for a townhouse was $665,984. This represents a 0.2 per cent increase from June 2022 and a decrease of 4.4 per cent compared to May 2023.
- The average sale price for an apartment-style condominium was $470,163. This represents a decrease of 6.2 per cent from June 2022 and a decrease of 3.3 per cent compared to May 2023.
- The average sale price for a semi was $691,507. This represents a decrease of 1.1 per cent compared to June 2022 and a decrease of 5.0 per cent compared to May 2023.

| MLS® Home Price Index Benchmark Price | ||||||
| | Kitchener-Waterloo | Cambridge | ||||
| Benchmark Type: | June 2023 | Monthly % Change | Yr./Yr. % Change | June 2023 | Monthly % Change | Yr./Yr. % Change |
| Composite | $777,800 | 0.1 | -2.0 | $778,600 | -1.6 | -3.4 |
| Detached | $889,400 | 0.2 | 0.7 | $815,300 | -1.9 | -1.0 |
| Townhouse | $645,200 | 1.7 | -5.9 | $660,100 | 1.2 | -14.7 |
| Apartment | $479,000 | -1.8 | -8.7 | $481,900 | 0.2 | -16.6 |

In June we saw robust demand for detached properties, driving a significant 10.5 per cent increase in the average sale price of a detached home, while the central bank raised its benchmark interest rate to 4.75 per cent near the beginning of the month, demand remains strong. Buyers and sellers can expect a competitive market as the number of homes for sale continues to be well below the long-term average.
There were 1,321 new listings added last month, a decrease of 21.6 per cent compared to June of last year and a 3.5 per cent increase compared to the previous ten-year average for June.
The total number of homes available for sale in active status at the end of June was 1007, a decrease of 23.1 per cent compared to June of last year and 32.8 per cent below the previous ten-year average of 1499 listings for June.
The number of months of inventory is up 5.9 per cent compared to June of last year, but still historically low at 1.8 months. The number of months of inventory represents how long it would take to sell off current inventories at the current sales rate.
The average number of days to sell in June was 15, compared to 13 days in June 2022. The previous 5-year average is 17 days.
Average Sales Price – Municipality

Average Sales Price – Township

Monthly Sales By Property Type

Monthly Supply of Homes for Sale

Monthly Median Sales Price – By Property Type

Monthly Average Sales Price – By Property Type

Monthly Average Days on Market

If you are thinking of buying or selling this summer/fall, wondering what the neighbor’s place sold for, or have any questions at all, give me a call, text at 519-497-4646 or shoot me an email to kevinbakerrealestate@gmail.com
Enjoy the great July weather!
Kevin
February Sales Down But Prices Remain Steady
I hope you and your family are enjoying a wonderful weekend and survived the house dumping of snow we received last night. The February Real Estate stats are out for Waterloo region and inventory is tight and sales continue to stay low as prices are remaining steady. Lets take a look at the numbers…
Sales volume set a new low for the month of February, with 439 homes sold, representing a decrease of 45.0 per cent compared to February 2022 and 31.5 per cent below the previous 5-year average for the month.
Once again, we experienced record low listing sales in February, Increased borrowing costs, coupled with a shortage of housing supply and strong demand, have put a strain on prospective buyers as affordability continues to be a top concern; however, home prices have remained stable for the past several months.
Total residential sales in February included 256 detached (down 45.3 per cent from February 2022), and 100 townhouses (down 33.3 per cent). Sales also included 55 condominium units (down 52.6 per cent) and 28 semi-detached homes (down 56.3 per cent).
In February, the average sale price for all residential properties in Waterloo Region was $758,698. This represents a 25.1 per cent decrease compared to February 2022 and a 0.6 per cent decrease compared to January 2023.
- The average price of a detached home was $877,884. This represents a 26.0 per cent decrease from February 2022 and a decrease 0.9 per cent compared to January 2023.
- The average sale price for a townhouse was $642,777. This represents a 25.6 per cent decrease from February 2022 and an increase of 2.7 per cent compared to January 2023.
- The average sale price for an apartment-style condominium was $461,322. This represents a decrease of 19.2 per cent from February 2022 and a decrease of 6.9 per cent compared to January 2023.
- The average sale price for a semi was $667,250. This represents a decrease of 25.8 per cent compared to February 2022 and an increase of 2.6 per cent compared to January 2023.

| MLS® Home Price Index Benchmark Price | ||||||
| Kitchener-Waterloo | Cambridge | |||||
| Benchmark Type: | February 2023 | Monthly % Change | Yr./Yr. % Change | February 2023 | Monthly % Change | Yr./Yr. % Change |
| Composite | $726,500 | 3.0 | -24.2 | $742,300 | 1.6 | -25.3 |
| Detached | $822,800 | 4.2 | -24.8 | $770,800 | 1.8 | -27.0 |
| Townhouse | $588,500 | 0.9 | -22.3 | $637,400 | -0.2 | -13.8 |
| Apartment | $473,800 | -1.6 | -14.3 | $492,100 | 0.9 | -7.6 |

Limited supply and the small number of listings coming to the market continues to be a trend within the region. There may be some hesitation for those considering selling their property due to decreased reported sale prices; however, with demand continuing to outpace supply and prices stabilizing, sellers are in a healthy position to make their move coming into a spring market.
Although prices have fallen more than 20 per cent from their peak in February 2022, they remain significantly higher than three years ago, which is great news for our local market.
There were 671 new listings added last month, a decrease of 37.1 per cent compared to February of last year and a 24.8 per cent decrease compared to the previous ten-year average for February.
The total number of homes available for sale in active status at the end of February was 692, an increase of 75.2 per cent compared to February of last year and 38.0 per cent below the previous ten-year average of 1117 listings for February.
The number of months of inventory is up 140.0 per cent compared to February of last year, but still historically low at 1.2 months. The number of months of inventory represents how long it would take to sell off current inventories at the current sales rate.
The average number of days to sell in February was 20, compared to 8 days in February 2022. The previous 5-year average is 16 days.
Average Sales Price – Municipality

Average Sales Price – Township

Monthly Sales By Property Type

Monthly Supply of Homes for Sale

Monthly Median Sales Price – By Property Type

Monthly Average Sales Price – By Property Type

Monthly Average Days on Market

The Real Estate market is changing very quickly, so If you are thinking of buying or selling this spring, wondering what the neighbor’s place sold for, or have any questions at all, give me a call, text at 519-497-4646 or shoot me an email to kevinbakerrealestate@gmail.com
Enjoy a wonderful March with your families!
Kevin
Condo Sales at record Lows in Waterloo Region
I hope you and your family are enjoying a wonderful weekend and staying warm. This cold snap certainly has been a frigid one! The January Real Estate stats are out for Waterloo region and inventory is tight and sales are low to start the year. Lets break things down…
The number of homes sold last month totalled 297 units, a decrease of 41.9 per cent compared to January 2022 and 31.0 per cent below the previous 5-year average for the month.
Waterloo Region’s home sales in January were at their second lowest of any single month in well over a decade, home sales tend to be sluggish in January, and while we expected activity to ease to reflect economic challenges, this was a larger drop than originally anticipated.
Total residential sales in January included 176 detached (down 38.5 per cent from January 2022), and 61 townhouses (down 44.5 per cent). Sales also included 43 condominium units (down 48.2 per cent) and 17 semi-detached homes (down 46.9 per cent).
In January, the average sale price for all residential properties in Waterloo Region was $764,063. This represents a 20.1 per cent decrease compared to January 2022 and a 5.9 per cent increase compared to December 2022.
- The average price of a detached home was $888,487. This represents a 21.5 per cent decrease from January 2022 and an increase of 7.6 per cent compared to December 2022.
- The average sale price for a townhouse was $625,831. This represents a 26.1 per cent decrease from January 2022 and an increase of 2.2 per cent compared to December 2022.
- The average sale price for an apartment-style condominium was $495,753. This represents a decrease of 9.3 per cent from January 2022 and an increase of 6.1 per cent compared to December 2022.
- The average sale price for a semi was $650,588. This represents a decrease of 21.5 per cent compared to January 2022 and an increase of 5.5 per cent compared to December 2022.

| MLS® Home Price Index Benchmark Price | ||||||
| | Kitchener-Waterloo | Cambridge | ||||
| Benchmark Type: | January 2023 | Monthly % Change | Yr./Yr. % Change | January 2023 | Monthly % Change | Yr./Yr. % Change |
| Composite | $705,100 | -1.2 | -23.7 | $731,000 | 2.4 | -21.3 |
| Detached | $789,900 | -1.4 | -25.9 | $757,200 | 2.9 | -23.2 |
| Townhouse | $583,100 | -1.8 | -17.6 | $638,300 | -0.2 | -8.0 |
| Apartment | $481,300 | 2.0 | -5.1 | $487,600 | -1.9 | -4.3 |

On a monthly basis, we saw the average sale price increase across all property types in January and I’m also noticing more multiple offers happening, especially on detached homes that are priced under eight hundred thousand dollars.
Meanwhile, the Bank of Canada again increased interest rates at the end of January by 25 basis points to 4.5 per cent. While not a huge increase, the continuance of interest rate hikes is an ongoing factor in the reduction of home sales within the market.
There were 579 new listings added last month, a decrease of 13.3 per cent compared to January of last year and a 28.7 per cent decrease compared to the previous ten-year average for January.
The total number of homes available for sale in active status at the end of January was 651, an increase of 167.9 per cent compared to January of last year and 34.7 per cent below the previous ten-year average of 998 listings for January.
The number of months of inventory is up 233.3 per cent compared to January of last year, but still historically low at one month. Between 2011 and 2015, January’s average months of inventory was 3.0 months. The number of months of inventory represents how long it would take to sell off current inventories at the current sales rate.
The average number of days to sell in January was 25, compared to 9 days in January 2022. The previous 5-year average is 21 days.
While the inventory levels are low, we are starting to see the GTA buyers come back to our local market after those buyers really subsided in the middle to later half of 2022. That is creating multiple offers once again and pushing prices back up in the short term.
Average Sales Price – Municipality

Average Sales Price – Township

Monthly Sales By Property Type

Monthly Supply of Homes for Sale

Monthly Median Sales Price – By Property Type

Monthly Average Sales Price – By Property Type

Monthly Average Days on Market

The Real Estate market is changing very quickly, so If you are thinking of buying or selling this spring, wondering what the neighbor’s place sold for, or have any questions at all, give me a call, text at 519-497-4646 or shoot me an email to kevinbakerrealestate@gmail.com
Enjoy a wonderful February!
Kevin
Home Sales Decline but Prices steady in Waterloo Region Real Estate
Happy Thanksgiving! I hope you and your family are able to spend a wonderful holiday together. The weather looks great for the rest of weekend and with the leaves starting to turn fall is certainly here.
The stats are out for September and sales were down considerably over last year and the 5 year average, but prices are starting to hold these levels and have been relatively flat the last 2 months.
There were 518 residential homes were sold last month, a decrease of 25.3 per cent compared to September 2021 and 30.8 per cent below the previous 5-year average for the month.
Total residential sales in September included 313 detached (down 18.9 per cent from September 2021), and 94 townhouses (down 39.0 per cent). Sales also included 60 condominium units (down 37.5 per cent) and 51 semi-detached homes (down 8.9 per cent).
Interest rate hikes have continued to put pressure on the housing market as a whole. The property type that saw the biggest decline in sales was the townhouse segment followed closely by condos, which could indicate there are fewer entry-level buyers in the market due to the higher borrowing costs.
In September, the average sale price for all residential properties in Waterloo Region was $752,421. This represents a 4.7 per cent decrease compared to September 2021 and a 0.1 per cent increase compared to August 2022.
- The average price of a detached home was $862,435. This represents a 7.4 per cent decrease from September 2021 and an increase of 1.3 per cent compared to August 2022.
- The average sale price for a townhouse was $638,284. This represents a 2.7 per cent decrease from September 2021 and an increase of 4.4 per cent compared to August 2022.
- The average sale price for an apartment-style condominium was $455,262. This represents a decrease of 8.5 per cent from September 2021 and a decrease of 2.3 per cent compared to August 2022.
- The average sale price for a semi was $637,205. This represents a decrease of 6.5 per cent compared to September 2021 and a decrease of 2.8 per cent compared to August 2022.

| MLS® Home Price Index Benchmark Price | ||||||
| Kitchener-Waterloo | Cambridge | |||||
| Benchmark Type: | September 2022 | Monthly % Change | Yr./Yr. % Change | September 2022 | Monthly % Change | Yr./Yr. % Change |
| Composite | $724,600 | -1.3 | -6.7 | $748,000 | -0.4 | -3.7 |
| Detached | $807,700 | -0.9 | -8.4 | $768,100 | 0.4 | -5.3 |
| Townhouse | $611,600 | -1.1 | 1.8 | $679,300 | -5.0 | 5.8 |
| Apartment | $493,800 | -3.9 | 9.7 | $556,600 | -3.8 | 16.5 |

While sales were down last month, we seem to be moving towards a more balanced market; buyers now have more inventory to choose from, yet sellers can still expect their properties to sell within a reasonable timeframe. We’re also observing that sale prices are shifting closer to the asking price. Furthermore, the sales-to-new listings ratio of 56.4 per cent in September compared to 70.8 per cent in August. (According to CMHC, a sales-to-new-listings ratio above 55 per cent is associated with a sellers’ market, while an overheating market corresponds to the upper range of a sellers’ market, with a ratio exceeding 70 per cent).
There were 918 new listings added last month, a decrease of 3.6 per cent compared to September of last year and a 15.9 per cent decrease compared to the previous ten-year average for September.
The total number of homes available for sale in active status at the end of September was 978, an increase of 108.5 per cent compared to September of last year and 35.4 per cent below the previous ten-year average of 1515 listings for September.
The number of months of inventory is up 180.0 per cent compared to September of last year, but still historically low at 1.4 months. Between 2009 and 2015, the average number of months of inventory for September was 3.7 months. The number of months of inventory represents how long it would take to sell off current inventories at the current sales rate.
The average number of days to sell in September was 23, compared to 10 days in September 2021. The previous 5-year average is 20 days. Average Sales Price – Municipalit

Average Sales Price – Township

Monthly Sales By Property Type

Monthly Supply of Homes for Sale

Monthly Median Sales Price – By Property Type

Monthly Average Sales Price – By Property Type

Monthly Average Days on Market

If you are thinking of buying or selling this fall, wondering what the neighbor’s place sold for, or have any questions at all, give me a call, text at 519-497-4646 or shoot me an email to kevinbakerrealestate@gmail.com
Enjoy the fall colors and have a wonderful Thanksgiving with your family.
Kevin
Rising Rates Continue to Put Pressure on Condo Prices in Waterloo Region
I hope you and your family are doing well and enjoying the beautiful summer weather we are having. With the kids going back to school they must be so excited to reunite with friends again now that covid restrictions are easing and things seem to be back to normal.
Given that school is now back in session, buyers focus will again turn to the real estate market. Rates are continuing to rise so hopefully we will see the market bottom soon and hold steady. Please keep in mind the stats are now including cambridge board as well with the amalgamation of Kitchener Waterloo and Cambridge. Lets take a look….
There were 659 residential homes were sold in August, a decrease of 8.1 per cent compared to August 2021 and 11.2 per cent below the previous 5-year average for the month.
Total residential sales in August included 413 detached (down 0.7 per cent from August 2021), and 117 townhouses (down 24.0 per cent). Sales also included 68 condominium units (down 26.1 per cent) and 61 semi-detached homes (up 10.9 per cent).
While the number of homes sold in August was down on a year-over-year basis they were up almost 19 per cent compared to July. The decline was most pronounced in the apartment-style condo and townhouse categories which could indicate that rising borrowing costs are having a greater impact on first-time buyers and those looking for more affordable options.
In August, the average sale price for all residential properties in Waterloo Region was $750,849. This represents a 0.4 per cent decrease compared to August 2021 and a 0.2 per cent decrease compared to July 2022.
- The average price of a detached home was $851,654. This represents a 3.0 per cent decrease from August 2021 and an increase of 1.1 per cent compared to July 2022.
- The average sale price for a townhouse was $610,725. This represents a 4.2 per cent decrease from August 2021 and a decrease of 5.2 per cent compared to July 2022.
- The average sale price for an apartment-style condominium was $464,959. This represents an increase of 4.3 per cent from August 2021 and a decrease of 10.9 per cent compared to July 2022.
- The average sale price for a semi was $655,813. This represents a decrease of 1.0 per cent compared to August 2021 and a decrease of 0.8 per cent compared to July 2022.

WRAR cautions that average sale price information can be useful in establishing long-term trends but should not be used as an indicator that specific properties have increased or decreased in value. The MLS® Home Price Index (HPI) provides the best way to gauge price trends because averages are strongly distorted by changes in the mix of sales activity from one month to the next.
| MLS® Home Price Index Benchmark Price | ||||||
| Kitchener-Waterloo | Cambridge | |||||
| Benchmark Type: | August 2022 | Monthly % Change | Yr./Yr. % Change | August 2022 | Monthly % Change | Yr./Yr. % Change |
| Composite | $734,500 | -1.9 | -2.2 | $750,700 | -3.4 | 0.6 |
| Detached | $815,000 | -1.5 | -3.9 | $764,700 | -3.1 | -1.3 |
| Townhouse | $618,400 | -3.8 | 5.4 | $715,200 | -5.9 | 11.7 |
| Apartment | $513,600 | -2.1 | 16.1 | $578,500 | -1.1 | 19.0 |

The announcement by the Bank of Canada to increase its policy rate by 75 basis points to 3.25 per cent is discouraging news for borrowers as it affects their purchasing power, however, we see signs that the market is moving towards more buyer-friendly conditions. There are fewer multiple offers resulting in final sale prices being closer to the asking price or with more conditions accompanying offers. Even so, with inventory still very tight.
There were 933 new listings added last month, an increase of 19.3 per cent compared to August of last year, and a 1.2 per cent increase compared to the previous ten-year average for August.
The total number of homes available for sale in active status at the end of August was 1,003, an increase of 188.2 per cent compared to August of last year, and 31.8 per cent below the previous ten-year average of 1593 listings for August.
The number of months of inventory is up 250 per cent compared to August of last year, but still historically low. There were 1.4 months of inventory in August 2022, down from 1.8 months in July 2022. The number of months of inventory represents how long it would take to sell off current inventories at the current sales rate.
The average number of days to sell in August was 22, compared to 12 days in August 2021. The previous 5-year average is 22 days.
Average Sales Price – Municipality

Average Sales Price – Township

Monthly Sales By Property Type

Monthly Supply of Homes for Sale

Monthly Median Sales Price – By Property Type

Monthly Average Sales Price – By Property Type

Monthly Average Days on Market

If you are thinking of buying or selling this fall, wondering what the neighbor’s place sold for, or have any questions at all, give me a call, text at 519-497-4646 or shoot me an email to kevinbakerrealestate@gmail.com
Enjoy the nice weather and have a great September!
Kevin
Condo Prices Dip in June Here in Waterloo Region
I hope you and your family are doing well and enjoyed your long holiday weekend. Summer is here so make sure you get out and enjoy the nice weather and hopefully some vacation time with the family.
The June stats are out and things are still cooling off in the housing market here in Waterloo region as expected with the threat of higher interest rates and a possible recession.
There were 561 residential homes sold in June, a decrease of 24.0 per cent compared to the same month last year, and 17.3 per cent below the previous 5-year average.
For the fourth consecutive month we’re seeing home prices moderate as the number of properties available for sale has steadily increased. In June the average price of a detached home has levelled off to where it was this time last year.
Total residential sales in June included 326 detached (down 20.7 per cent from June 2021), and 103 townhouses (down 32.2 per cent). Sales also included 84 condominium units (down 18.4 per cent) and 48 semi-detached homes (down 33.3 per cent).
In June, the average sale price for all residential properties in the Kitchener-Waterloo area was $791,674. This represents a 4.2 per cent increase over June 2021 and a 9.6 per cent decrease compared to May 2022.
- The average price of a detached home was $920,349. This represents a 0.0 per cent change from June 2021 and a decrease 9.5 per cent compared to May 2022.

The MLS® HPI composite benchmark price for all residential properties in Kitchener-Waterloo was $790,600 in June. This represents a 6.8 per cent increase over June 2021 and a 6.8 per cent decrease compared to May 2022.
- The benchmark price for a detached home was $876,600. This represents a 5.3 per cent increase from June 2021 and 7.3 per cent decrease compared to May 2022.

This time last year, sales were going through the roof, but the home buying scene is a little different this year with the recent mortgage rate hikes both long and short term as well as the possibility of a recession hitting the global economy.
While any shift in the market will result in some individuals predicting the worse, the simple reality is that the market we had been in was unsustainable. What this means for buyers is more inventory, more choices, and perhaps most importantly, potentially less stress when purchasing. For sellers, they need to ensure their properties stand out from the competition and be aware it may take more time to sell their home and for potentially less money than they were expecting.
There were 1,285 new listings added last month, an increase of 49.2 per cent compared to June of last year, and a 41.7 per cent increase compared to the previous ten-year average for June.
The total number of homes available for sale in active status at the end of June was 991, an increase of 165.0 per cent compared to June of last year, and 20.6 per cent below the previous ten-year average of 1249 listings for June.
The number of months of inventory increased to 1.8 months in June from 1.6 months in May. While inventory is still at historic lows, this is the highest it’s been since September 2019 and a return to where inventory was in the pre-pandemic June of 2019. The number of months of inventory represents how long it would take to sell off current inventories at the current rate of sales.
The average number of days to sell in June was 13 days, compared to 11 days in June 2021. The previous 5-year average is 17 days. Keep in mind though this number is skewed in my opinion due to home listings being cancelled and relisted after a week or two.
Historical Sales By Property Type

Months Supply of Homes for Sale

Historical Median Sales Price – By Property Type

Historical Average Sales Price – By Property Type


If you are thinking of buying or selling this summer, wondering what the neighbor’s place sold for, or have any questions at all, give me a call, text at 519-497-4646 or shoot me an email to kevinbakerrealestate@gmail.com
Enjoy the nice weather and have a great July!
Kevin
Condo sales in may slow and inventory levels are up in Kitchener, Waterloo and Cambridge
I hope you and your family are doing well. Summer is here so make sure you get out and enjoy the nice weather. I for one am looking forward to some well deserved vaction time out of my house 🙂
May stats are out and the market continues to be a little slower than what we have been used to over the past 3-4 years. There were 661 residential homes sold in May, a decrease of 22.7 per cent compared to the same month last year, and 5.5 per cent below the previous 5-year average.
The increase by the Bank of Canada to the key interest rate in April had the predictable result of knocking some buyers down if not out of the market in May unfortunatley. While the impact to prices is small, it has had a critical impact on some buyers and what they can now afford.
Total residential sales in May included 404 detached (down 16.7 per cent from May 2021), and 115 townhouses (down 38.5 per cent). Sales also included 95 condominium units (down 12.0 per cent) and 47 semi-detached homes (down 36.5 per cent).
In May, the average sale price for all residential properties in the Kitchener-Waterloo area was $875,194. This represents a 18.3 per cent increase over May 2021 and a 3.5 per cent decrease compared to April 2022.
- The average price of a detached home was $1,016,834. This represents a 17.0 per cent increase from May 2021 and a decrease 4.2 per cent compared to April 2022.
- The average sale price for a townhouse was $708,722. This represents a 17.7 per cent increase from May 2021 and a decrease of 7.2 per cent compared to April 2022.
- The average sale price for an apartment-style condominium was $545,825. This represents an increase of 19.7 per cent from May 2021 and a decrease of 9.1 per cent compared to April 2022.
- The average sale price for a semi was $730,768. This represents an increase of 10.7 per cent compared to May 2021 and a decrease of 7.0 per cent compared to April 2022.

KWAR cautions that average sale price information can be useful in establishing long-term trends but should not be used as an indicator that specific properties have increased or decreased in value. The MLS® Home Price Index (HPI) provides the best way to gauge price trends because averages are strongly distorted by changes in the mix of sales activity from one month to the next.
The MLS® HPI composite benchmark price for all residential properties in Kitchener-Waterloo was $848,600 in May. This represents a 15.1 per cent increase over May 2021 and a 4.7 per cent decrease compared to April 2022.
- The benchmark price for a detached home was $945,800. This represents a 14.6 per cent increase from May 2021 and 4.9 per cent decrease compared to April 2022.
- The benchmark price for a townhouse is $728,300. This represents a 22.6 per cent increase from May 2021 and a 5.1 per cent decrease compared to April 2022.
- The benchmark price for an apartment-style condominium was $550,100. This represents a 26.9 per cent increase from May 2021 and a 1.8 per cent decrease compared to April 2022.

With the announcement from the Bank of Canada about another interest rate hike this week we may see a resurgence of buyers who have locked in at a lesser rate, but as borrowing costs continue to increase, we should expect demand will continue to soften, particularly in the more entry-level segment of the market.
There were 1,422 new listings in KW and area last month, an increase of 33.9 per cent compared to May of last year, and a 40.4 per cent increase compared to the previous ten-year average for May.
The total number of homes available for sale in active status at the end of May was 902, an increase of 98.2 per cent compared to May of last year, and 28.8 per cent below the previous ten-year average of 1267 listings for May.
The number of months of inventory increased to 1.6 months in May from 1.2 months in April. While inventory is still at historic lows, this is the highest it’s been since September 2019. The number of months of inventory represents how long it would take to sell off current inventories at the current rate of sales.
The average number of days to sell in May was 11 days, compared to 9 days in May 2021. The previous 5-year average is 16 days. This number can show as a bit skewed though as many homes are listing, not receiving offers and then cancelled and reslisted a few weeks later showing up as a new listing and keeping the days on market lower than what truely is happening.
I think what you have to remember is that even though the market is starting to pull back and its taking a little longer to sell homes, we are still in a historically great market for buying and selling. Don’t let all the negative news hype out there affect your bias on things.
Historical Sales By Property Type

Months Supply of Homes for Sale

Historical Median Sales Price – By Property Type

Historical Average Sales Price – By Property Type


If you are thinking of buying or selling this summer, wondering what the neighbor’s place sold for, or have any questions at all, give me a call, text at 519-497-4646 or shoot me an email to kevinbakerrealestate@gmail.com
Enjoy the nicer weather and have a great June!
Kevin
Condo prices flat as inventory increases in Waterloo Region
I hope you and your family are doing well and you had a nice Easter. Looks like the spring weather if finally here as well which is great news for Mothers day weekend!
The market stats are out for April and the market is still showing signs of a slight pull back compared to what we seen earlier in the year. Last month introduced a small measure of relief especially for buyers and we’re seeing fewer multiple offers and more conditions on offers making their way back into the market.
There were 633 residential homes sold in April 2022 which is a decrease of 25.0 per cent compared to April 2021. On a month-over-month basis, sales in April were down 13.4 per cent compared to March 2022. The previous ten-year average number of residential sales for April is 608 (650 if not including April 2020 when home sales came to a short-term pause due to the beginning of the Covid-19 pandemic).
Total residential sales in April included 361 (down 25.4 per cent from April 2021), and 107 condominium units (down 2.7 per cent). Sales also included 48 semi-detached homes (down 29.4 per cent) and 117 townhouses (down 35.7 per cent).
In April, the average sale price for all residential properties in the Kitchener-Waterloo area was $907,205. This represents a 19.6 per cent increase over April 2021 and a 5.5 per cent decrease compared to March 2022.
- The average price of a detached home was $1,060,992. This represents a 18.0 per cent increase from April 2021 and a decrease 6.4 per cent compared to March 2022.

The MLS® HPI composite benchmark price for all residential properties in Kitchener-Waterloo was $929,300 in April. This represents a 24.5 per cent increase over April 2021 and a 3.2 per cent decrease compared to March 2022.
- The benchmark price for a detached home was $998,400. This represents a 23.4 per cent increase from April 2021 and 4.6 per cent decrease compared to March 2022.

The trajectory the market was on was simply not sustainable, however, I want to emphasize it would be premature to draw any conclusions on just a single month’s activity. The housing market in Waterloo Region is still very much a sellers’ market, but sellers may need to adjust their expectations. We noticed this shift after the Bank of Canada’s recent rate increase reinforcing that it has been cheap money empowering too many buyers to chase after too few listings driving the market rather than anything else.
There were 1,277 new listings added to the MLS® System in KW and area last month, an increase of 16.2 per cent compared to April of last year, and a 40.2 per cent increase compared to the previous ten-year average for April.
The total number of homes available for sale in active status at the end of April was 703, an increase of 48.6 per cent compared to April of last year, and 39.9 per cent below the previous ten-year average of 1,169 listings for April. This is the first time since September 2019 that the total number of homes for sale metric has been over 700.
The number of months of inventory increased to 1.2 months in April from 0.7 months in March. This is the first time since September 2020 that inventory has nudged above the one-month mark. The number of months of inventory represents how long it would take to sell off current inventories at the current rate of sales.
The average number of days to sell in April was 9 days, the same as it was in April 2021. The previous 5-year average is 16 days.
Historical Sales By Property Type

Months Supply of Homes for Sale

Historical Median Sales Price – By Property Type

Historical Average Sales Price – By Property Type


If you are thinking of buying or selling this spring, wondering what the neighbor’s place sold for, or have any questions at all, give me a call, text at 519-497-4646 or shoot me an email to kevinbakerrealestate@gmail.com
Enjoy the nicer weather and Happy Mothers Day to all the Mom’s out there!
Kevin
March Condo Sales up but prices dip for Kitchener Waterloo Real Estate
I hope you and your family are doing well. Looks like spring is here and Easter is just around the corner. The March stats are out and home sales are up over February, but prices have taken a small dip from the february average as well. Lets take a look at the numbers…
There were 725 residential homes sold in March 2022 is a decrease of 27.1 per cent compared to March 2021, which continues to hold the record for most home sales in a single month. On a month-over-month basis, sales in March were up 19.4 per cent compared to February 2022. The previous ten-year average number of residential sales for March is 599.
The skyrocketing prices of the last two months took a bit of a breather in March, with the overall average price dipping five per cent compared to what we saw in February. While it is too soon to draw conclusions from just one month of home sales, I know many will be comforted to see a leveling off on the average price, no matter how incremental.
Total residential sales in March included 416 detached (down 29.7 per cent from March 2021), and 114 condominium units (down 9.5 per cent). Sales also included 64 semi-detached homes (down 17.9 per cent) and 131 townhouses (down 33.8 per cent).
In March, the average sale price for all residential properties in the Kitchener-Waterloo area was $960,181. This represents a 25.5 per cent increase over March 2021 and a 4.6 per cent decrease compared to February 2022.
- The average price of a detached home was $1,132,637. This represents a 25.9 per cent increase from March 2021 and a decrease 6.4 per cent compared to February 2022.

The MLS® HPI composite benchmark price for all residential properties in Kitchener-Waterloo was $960,100 in March. This represents a 29.6 per cent increase over March 2021 and a 1.5 per cent decrease compared to February 2022.
- The benchmark price for a detached home was $1,046,200. This represents a 28.1 per cent increase from March 2021 and 4.0 per cent decrease compared to February 2022.

Even though the average price decreased across all property types on a month-to-month basis, the MLS® HPI showed continued monthly gains for both townhouse and apartment property types. As the province feels its way out of the pandemic, we are beginning to see some very preliminary signs of a potential cooling. We are not seeing quite as many multiple offers and some offers are coming in with conditions. Of course, when we say cooling, we’re talking about a market that has been scorching hot which is why we are pleased to see this happening.
There were 1,131 new listings added last month, a decrease 16.8 per cent compared to the record topping number of listings added in March of last year, and a 28.0 per cent increase compared to the previous ten-year average for March.
The total number of homes available for sale in active status at the end of March was 441, an increase of 1.1 per cent compared to March of last year, and 59.0 per cent below the previous ten-year average of 1,072 listings for March.
The number of months of inventory nudged up to 0.7 months in March from 0.5 months in February. Inventory has been under the one-month mark since October 2020. The number of months of inventory represents how long it would take to sell off current inventories at the current rate of sales.
The average number of days to sell in March was 8 days, the same as it was in March 2021. The previous 5-year average is 16 days.
Historical Sales By Property Type

Months Supply of Homes for Sale

Historical Median Sales Price – By Property Type

Historical Average Sales Price – By Property Type


If you are thinking of buying or selling this spring, wondering what the neighbor’s place sold for, or have any questions at all, give me a call, text at 519-497-4646 or shoot me an email to kevinbakerrealestate@gmail.com
Enjoy the nicer weather and have a wonderful Easter with your family!
Kevin
The Trend Continues for Condos Prices here in Waterloo Region
I hope you and your family are doing well. The kids are back in school and fall seems to be here. Thanksgiving is next weekend and Halloween will be here before we know it.
I wanted to give you a quick update on the housing numbers for last month. A total of 506 residential homes sold last month, a decrease of 32.1 per cent compared to last September and a decrease of 5.9 per cent compared to August. While the total number of homes sold last month was down considerably compared to last September, it can still be considered an above average month of activity when we remember that last September smashed any previous September for number of sales. In fact, I would say we are on track for setting a record number of annual sales in 2021.
Total residential sales in September included 267 detached (down 37.3 per cent from September 2020), and 83 condominium units (down 11.7 per cent). Sales also included 41 semi-detached homes (down 21.2) and 115 townhouses (down 33.5 per cent).
In September, the average sale price for all residential properties in the Kitchener-Waterloo area was $792,599. This represents a 24.2 per cent increase over September 2020 and a 5.7 per cent increase compared to August 2021.
- The average price of a detached home was $963,646. This represents a 24.9 per cent increase from September 2020 and an increase of 7.9 per cent compared to August 2021.
- The average sale price for an apartment-style condominium was $497,949. This represents an increase of 28.6 per cent from September 2020 and an increase of 12.4 per cent compared to August 2021.
- The average sale price for a townhouse was $646,026. This represents a 35.7 per cent increase from September 2020 and an increase of 3.7 per cent compared to August 2021.
- The average sale price for a semi was $686,316. This represents an increase of 26.1 per cent compared to September 2020 and an increase of 0.5 per cent compared to August 2021.

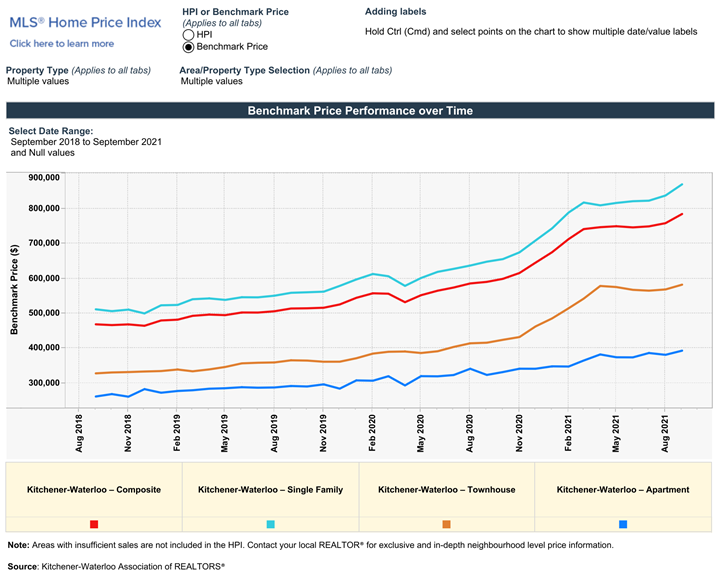
The MLS® HPI composite benchmark price for all residential properties in Kitchener-Waterloo was $784,200 in September. This represents a 33.0 per cent increase over September 2020 and a 3.5 per cent increase compared to August 2021.
- The benchmark price for a detached home was $869,220. This represents a 34.2 per cent increase from September 2020 and 3.8 per cent increase compared to August 2021.
- The benchmark price for an apartment-style condominium was $392,600. This represents a 21.5 per cent increase from September 2020 and a 3.1 per cent increase compared to August 2021.
- The benchmark price for a townhouse is $581,700. This represents a 40.0 per cent increase from September 2020 and a 2.4 per cent increase compared to August 2021.
There were 698 new listings added last month, a decrease of 23.4 per cent compared to September of last year, and a 13 per cent decrease compared to the previous ten-year average for September.
The total number of homes available for sale in active status at the end of September was 345, a decrease of 35.3 per cent compared to September of last year, and 73.2 per cent below the previous ten-year average of 1,285 listings for September.
Home prices reached all new highs in September, and while there is a growing call to add more transparency to how real estate is traded in Ontario —the brutal reality of this market is that supply is simply not keeping up with demand and that is what is driving up prices.
The number of months of inventory nudged up slightly from August’s 0.4 months to half a month in September. Inventory has settled at under 1 month for the past 11 consecutive months. The number of months of inventory represents how long it would take to sell off current inventories at the current rate of sales.
If you are thinking of buying or selling in the coming months, wonder what the neighbor sold for, or have any questions at all, give me a call, text at 519-497-4646 or shoot me an email to kevinbaker@kwhometeam.ca.
Have a wonderful rest of your week and Happy Thanksgiving!
Kevin
Inventory is tight in Kitchener Waterloo Condo market
I hope you and your family are enjoying the last few days of summer before back to school starts. The weather the past week has been beautiful and I bet the kids must be so excited to be back with their friends again.
I thought with fall approaching you would like a quick update on the Waterloo region housing market. A total of 535 residential homes sold last month, a decrease of 22.1 per cent compared to last August’s record-smashing month, and a decrease of 12.3 per cent compared to July.
While sales were down relative to last month and last August, they remained well above average. The main reason for the decrease is simply that last month was the first full month in Step 3 of the reopening, and people are tired of being locked down. They got out and enjoyed their summer and shifted their real estate needs to the back burner for a much-needed change of focus.
Total residential sales in August included 299 detached (down 30.6 per cent from August 2020), and 80 condominium units (down 1.2 per cent). Sales also included 38 semi-detached homes (down 2.6) and 118 townhouses (down 13.2 per cent).
In August, the average sale price for all residential properties in the Kitchener-Waterloo area was $753,296. This represents a 19.3 per cent increase over August 2020 and a 0.3 per cent decrease compared to July 2021.
- The average price of a detached home was $895,756. This represents a 22.5 per cent increase from August 2020 and a decrease of 1.3 per cent compared to July 2021.
- The average sale price for an apartment-style condominium was $445,280. This represents an increase of 18.2 per cent from August 2020 and an increase of 3.7 per cent compared to July 2021.
- The average sale price for a townhouse was $623,767. This represents a 26.1 per cent increase from August 2020 and an increase of 0.1 per cent compared to July 2021.
- The average sale price for a semi was $683,048. This represents an increase of 26.5 per cent compared to August 2020 and an increase of 2.3 per cent compared to July 2021.
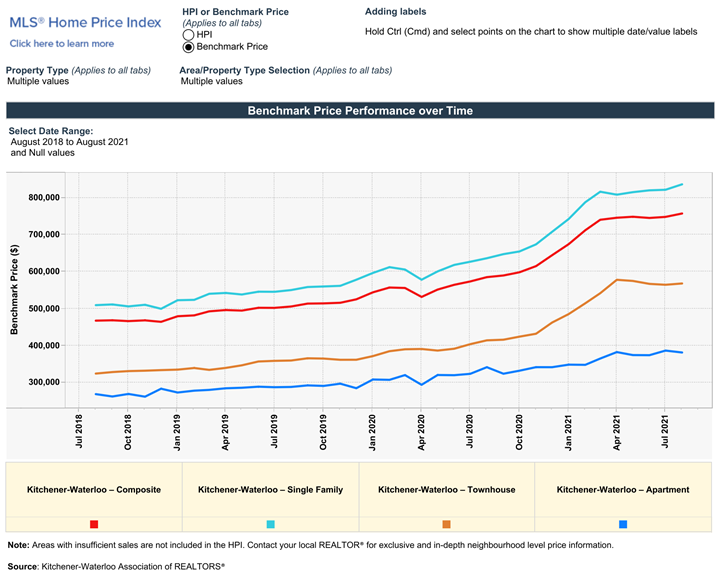
The MLS® HPI composite benchmark price for all residential properties in Kitchener-Waterloo was $757,900 in August. This represents a 29.5 per cent increase over August 2020 and a 1.2 per cent increase compared to July 2021.
- The benchmark price for a detached home was $837,100. This represents a 31.5 per cent increase from August 2020 and 1.8 per cent increase compared to July 2021.
- The benchmark price for an apartment-style condominium was $380,700. This represents a 11.7 per cent increase from August 2020 and a 1.3 per cent decrease compared to July 2021.
- The benchmark price for a townhouse is $568,000. This represents a 37.3 per cent increase from August 2020 and a 0.6 per cent increase compared to July 2021.
There were 590 new listings added to the MLS® System in KW and area last month, a decrease of 27.6 per cent compared to August of last year, and a 13 per cent decrease compared to the previous ten-year average for August.
The total number of homes available for sale in active status at the end of August was 255, a decrease of 53.6 per cent compared to August of last year, and 79.5 per cent below the previous ten-year average of 1,252 listings for August.
The number of homes coming to market continues to be overwhelmed by the number of homebuyers we have wanting to purchase in Waterloo Region.
The number of months of inventory persisted from the July level of 0.4 months in August. Inventory has numbered less than 1 month since October. The number of months of inventory represents how long it would take to sell off current inventories at the current rate of sales.
The average number of days to sell in August was 12 days, compared to 17 days in August 2020 and a previous 5-year average of 26 days.
If you are thinking of buying or selling in the coming months, wonder what the neighbor sold for, or have any questions at all, give me a call, text at 519-497-4646 or shoot me an email to kevinbaker@kwhometeam.ca.
Have a wonderful rest of the long weekend and stay safe!
Kevin
