
Strong Condo Sales in Kitchener Waterloo for June!
Hope you had a wonderful long Canada Day weekend. The weather was absolutely perfect and looks like its going to be a hot one for July.
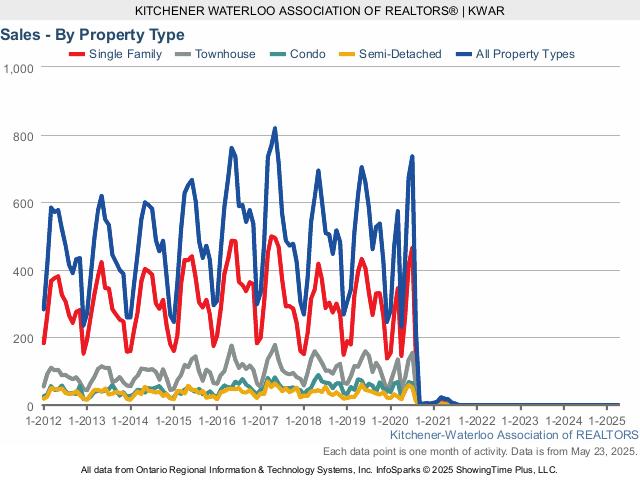
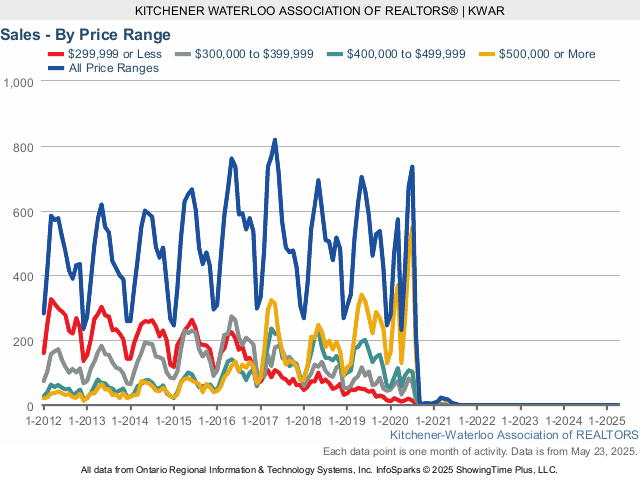
Here are the stats from the July and the market here in Waterloo Region continues to stay strong. There were 658 residential properties sold through the Multiple Listing System (MLS® System) in June, representing an increase of 8.8 per cent compared to the same month last year.
Home sales in June included 404 detached (up 8.9 per cent), and 50 condominium apartments (down 28.6 per cent). Sales also included 159 townhouses (up 27.2 per cent) and 45 semi-detached homes (up 15.4 per cent).
A total of 3,154 homes have sold in Kitchener-Waterloo and area during the first half of this year, an increase of 1.4 per cent compared to 2018.
The average sale price of all residential properties sold in June increased by 8.9 per cent to $533,619 compared to June 2018. Detached homes sold for an average price of $618,186 an increase of 7.9 per cent compared to June of last year. During this same period, the average sale price for an apartment style condominium was $332,716 for an increase of 4.4 per cent. Town homes and semis sold for an average of $411,126 (up 10.7 per cent) and $430,427 (up 9.9 per cent) respectively.
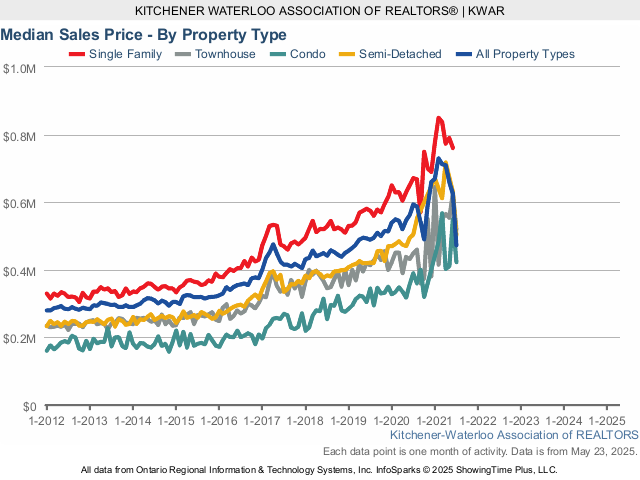
The median price of all residential properties sold last month increased 9.9 per cent to $494,500, and the median price of a detached home during the same period increased by 11.7 per cent to $581,500
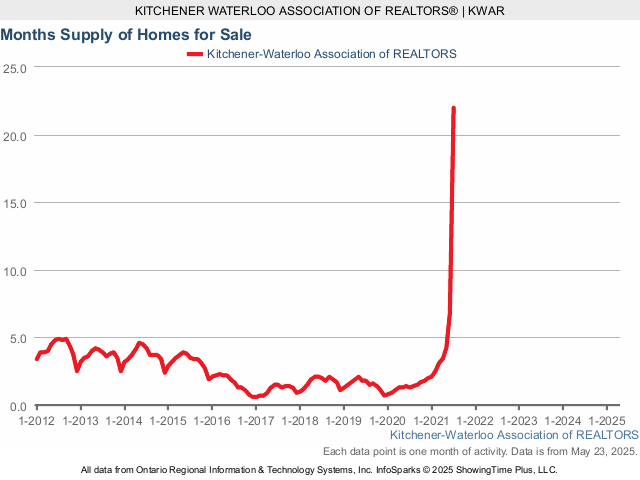
There were 888 residential properties listed in K-W and area last month, an increase of 4.3 per cent compared to June of 2018, and a slight increase of 0.5 per cent in comparison to the previous ten-year average for the month of June. The total number of homes available for sale in active status at the end of June totaled 890, a decrease of 10.8 per cent compared to June of last year, and well below the previous ten-year average of 1,581 listings for June. Months Supply of Homes for sale stood at 1.8 months in June, which is 14.3 percent lower than the same period last year.
We’re still in a solid seller’s market situation heading into the summer months, while more new listings are coming onto the market, strong buying demand is keeping supply tight.
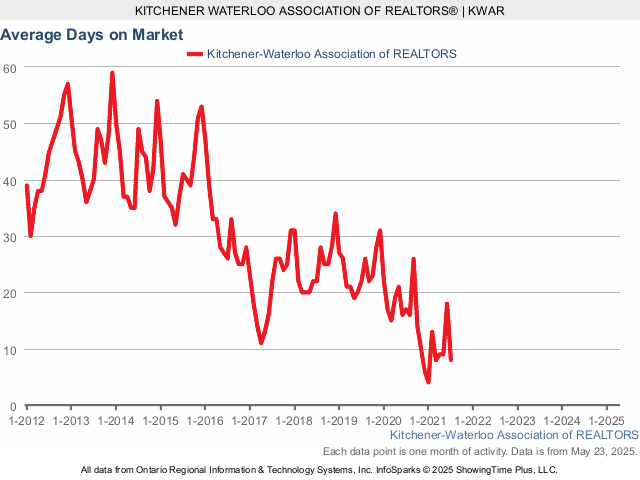
The average days it took to sell a home in June was 20 days, compared to 22 days in June 2018.
Here are some charts to compare different parts of the market over the last 10 years.
Historical Sales By Property Type
Months Supply of Homes for Sale
Historical Median Sales Price – By Property Type
Historical Average Sales Price – By Property Type

Historical Sales – By Price Range
Historical Average Days on Market
If you have any questions or have been thinking of making a move this summer or in the fall, give me a call or text at 519-497-4646 or shoot me an email to kevinbaker@kwhometeam.ca and lets sit down, grab a coffee and plan out a strategy that is best suited for your families needs.
Have a great July!
Kevin

Leave a comment