Hope you enjoyed a wonderful long weekend and the beautiful summer weather we have been having.
It was another crazy month for home prices here in Waterloo Region. Competition stays very high for buyers looking to lock down a house in July. With the rules around covid relaxing and more people getting out with Phase 3 opening the demand for homes has increased for sure.
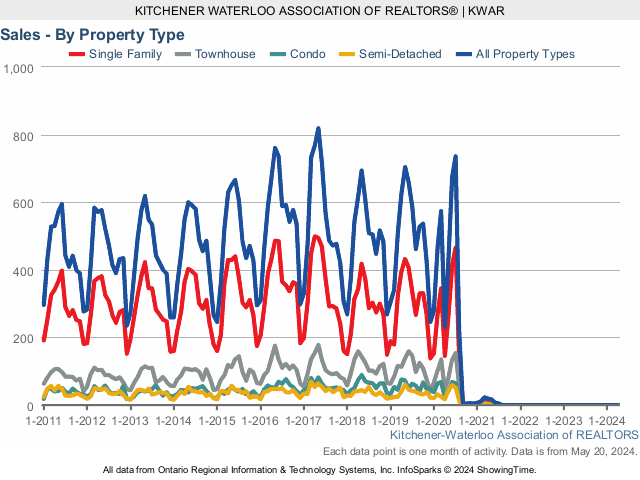
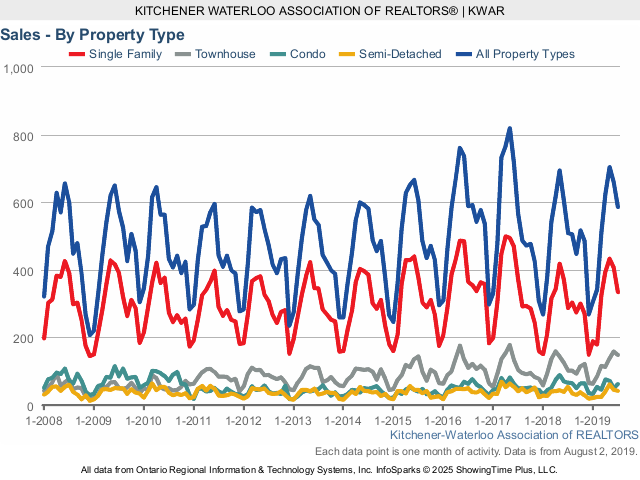
There were 734 residential homes sold in July, an increase of 25.7 per cent compared to the same month last year, and well above the previous ten-year average for July of 531.
Total residential sales in July included 464 detached homes (up 39.3 per cent from July 2019), and 65 condominium apartments (up 3.2 per cent). Sales also included 153 townhouses (up 4.8 per cent) and 52 semi-detached homes (up 23.8 per cent).
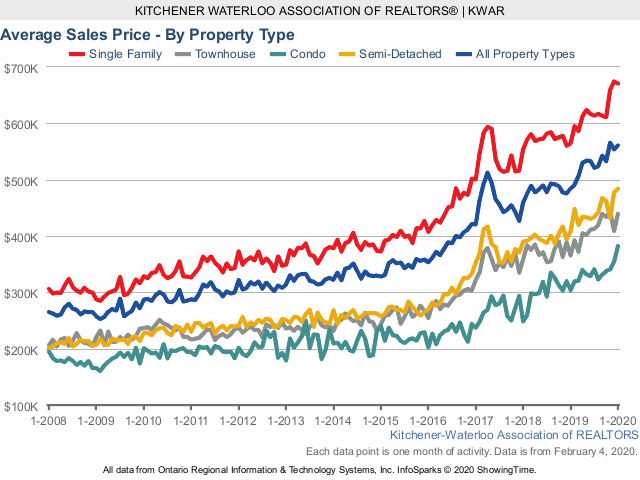
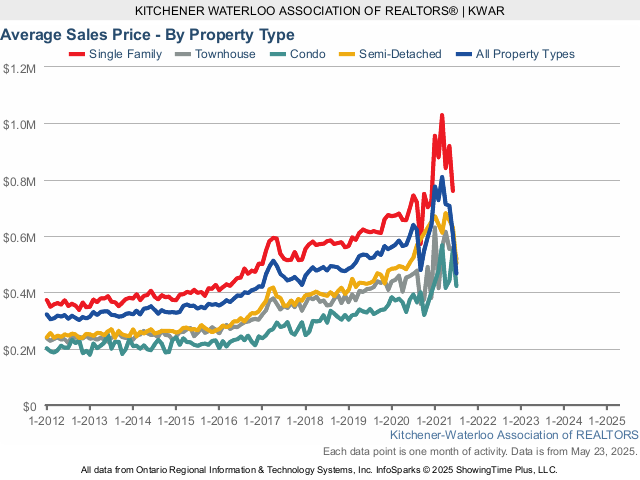
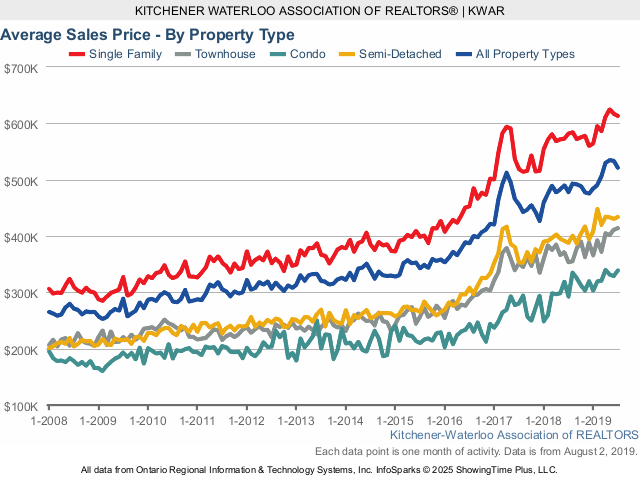
The average sale price of all residential properties sold in July increased 22.8 per cent to $639,814 compared to the same month last year, while detached homes sold for an average price of $745,149 an increase of 21.4 per cent. During this same period, the average sale price for an apartment-style condominium was $392,770 for an increase of 15.2 per cent. Townhomes and semis sold for an average of $465,756 (up 12.8 per cent) and $522,872 (up 20.4 per cent) respectively.
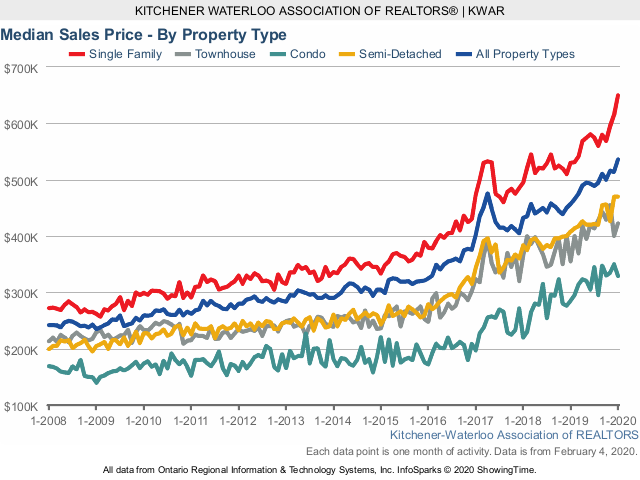
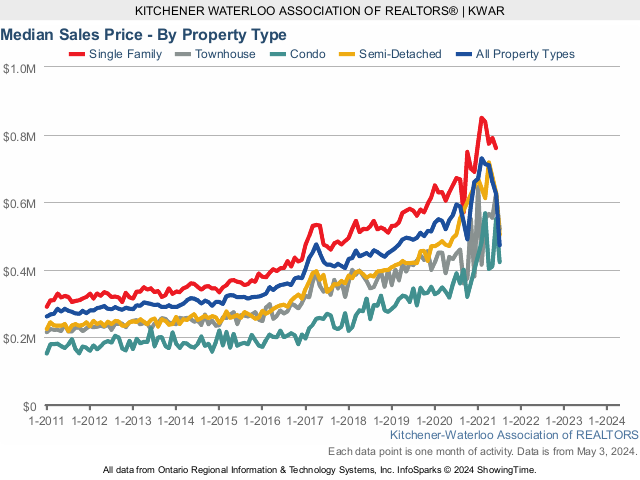
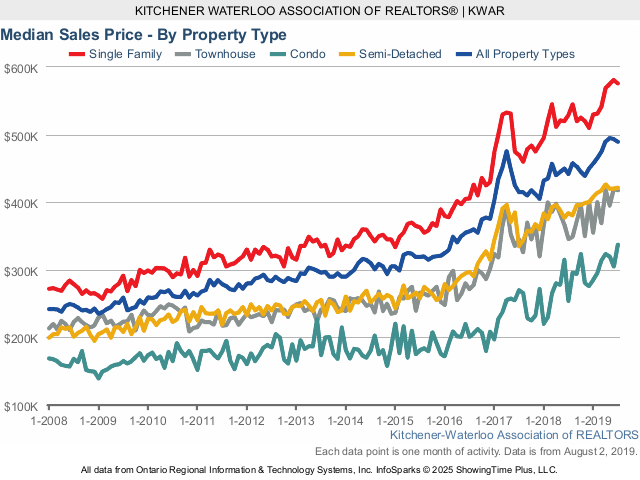
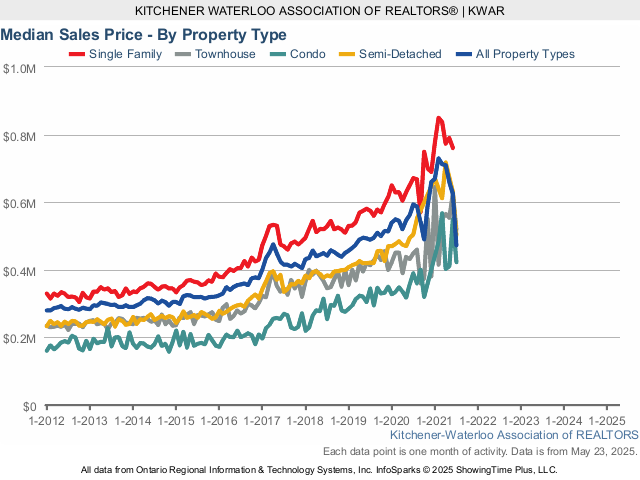
The median price of all residential properties sold in July increased 21.7 per cent to $595,000 and the median price of a detached home during the same period increased 17.4 per cent to $675,000.
With mortgage rates near all time lows homebuyers remain very confident about owning a home in Waterloo Region and I expect this to contunie going into the fall.
There were 888 new listings added, an increase of 4.3 per cent compared to July of last year, and 15.5 per cent more than the previous ten-year average for July.
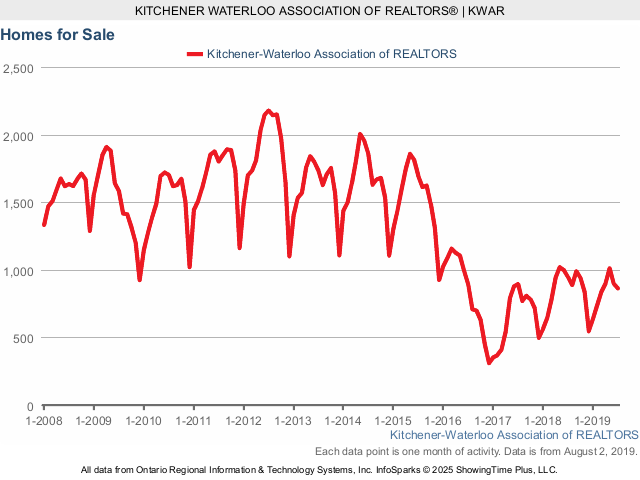
The total number of homes available for sale in active status at the end of July was 592, a decrease of 32.6 per cent compared to July of last year.
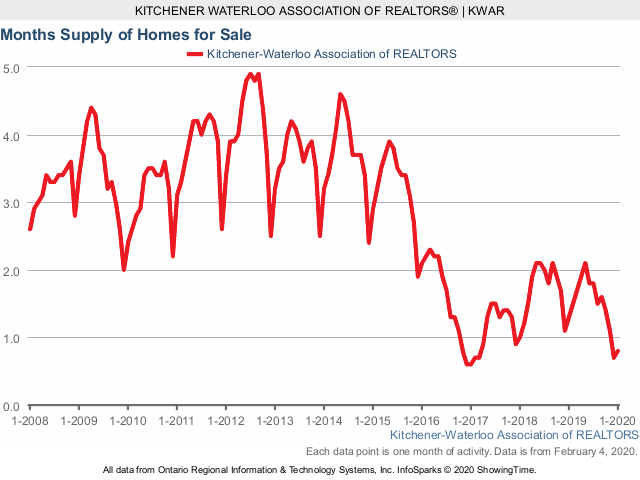
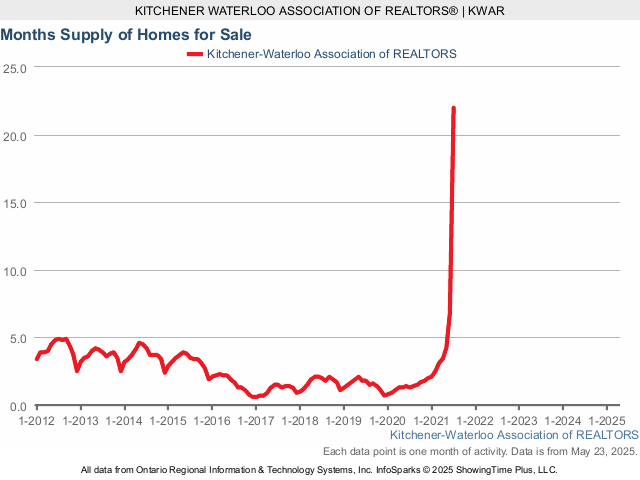
The number of Months Supply (also known as absorption rate) continues to be very low at just 1.3 months for the month of July, 27.8 per cent below the same period last year. The previous ten-year average supply of homes for July was 3.1 months, and in the past 5 years, the average supply for July was 2.1 months.
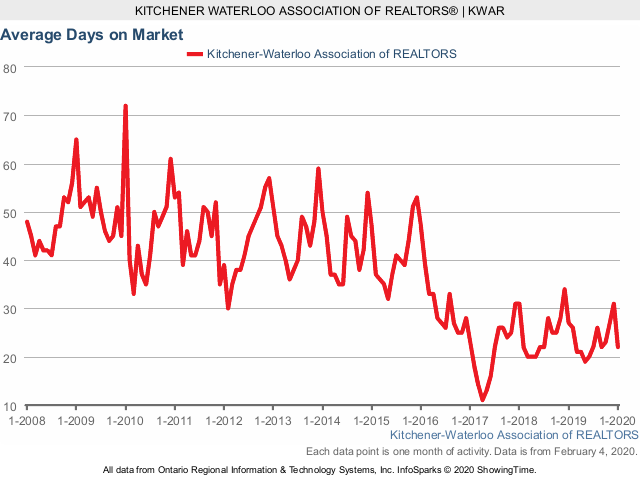
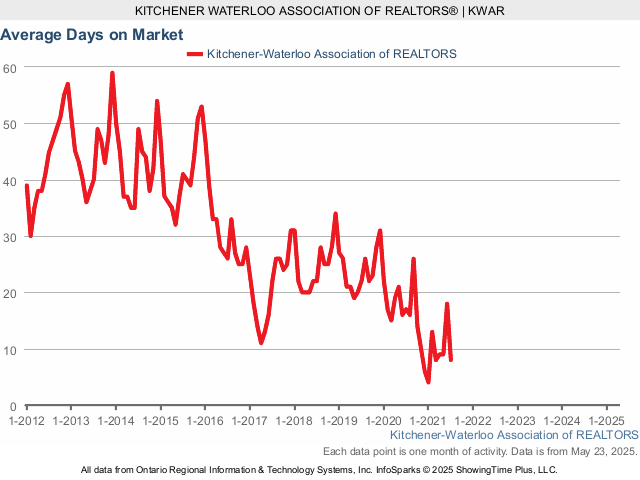
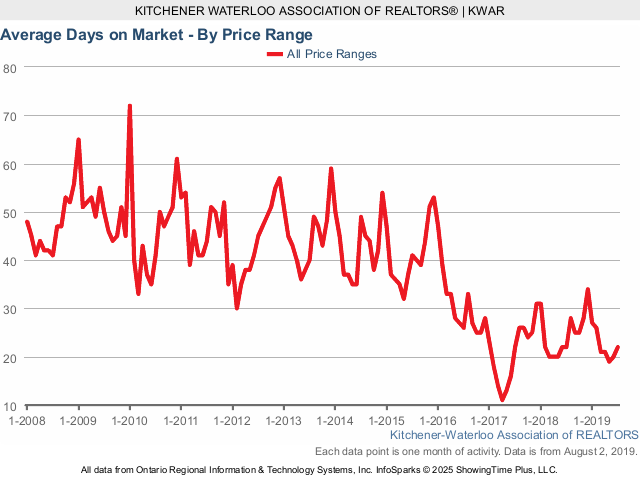
The average days to sell in July was 17 days, compared to 22 days in July 2019.
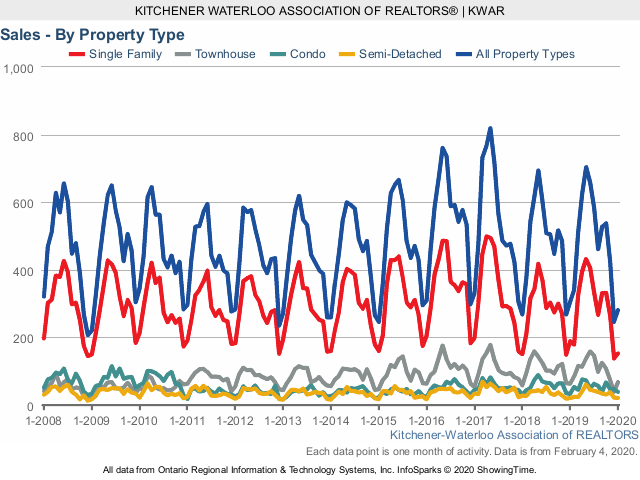
Historical Sales By Property Type

Months Supply of Homes for Sale

Historical Median Sales Price – By Property Type

Historical Average Sales Price – By Property Type

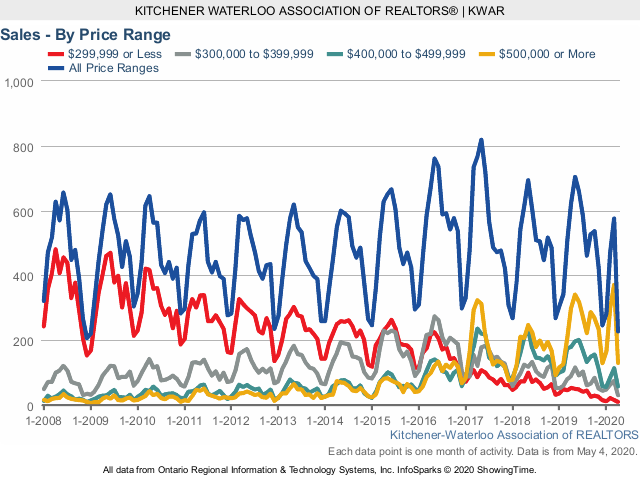
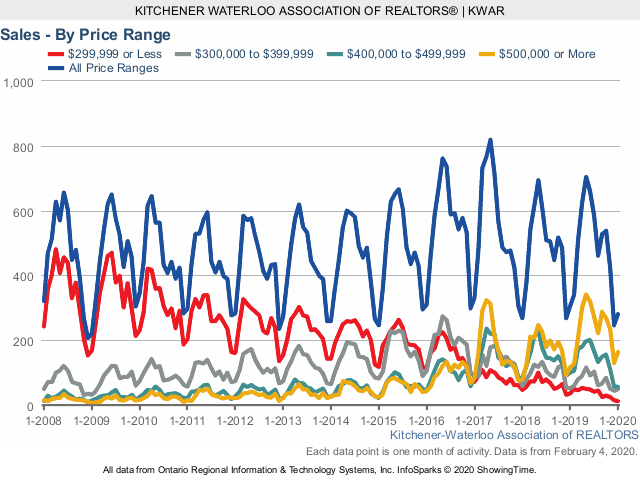
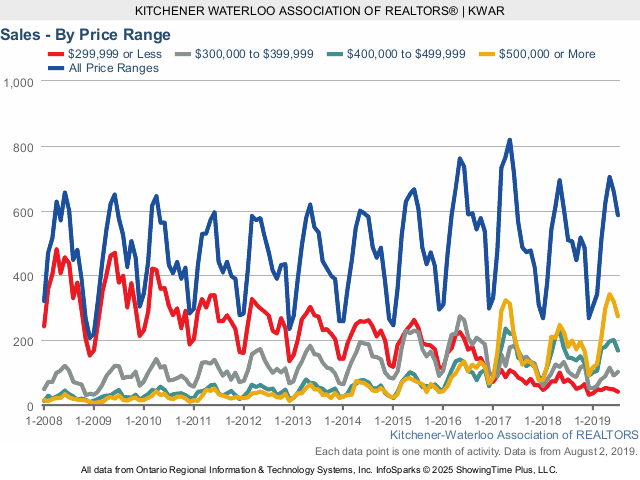
Historical Sales – By Price Range

Average Days on Market

If you are thinking of buying or selling in the coming months or have any questions at all, give me a call, text at 519-497-4646 or shoot me an email to kevinbaker@kwhometeam.ca Stay healthy and stay safe!
Have a great weekend!
Kevin
August 6, 2020 | Categories: Buyers, Kitchener Waterloo, Loft Style, New Construction, Sellers, Uncategorized | Tags: 1 victoria, 100 garment, 100 victoria, 144 park, 42 bridgeport, 85 duke, agent, agents, april, arrow, arrow lofts, assessment, assessment value, bank of canada, banks, barra condos, bauer, bauer lofts, big banks, blackberry, Buyers, bylaw, cambridge, canada trust, canadian mortgage housing corporation, carbon monoxide, charlie west, CHMC, cibc, city center, city center lofts, city centre, city centre condo, city centre condos, closing costs, closing paperwork, CMHC, condo, condo buyer, condo buying, condo costs, condo lofts, condo prices, condo sales, condo selling, condo unit, condo units, condo update, condo value, condominiums, condos, condos for sale, contribution, corona, covid, covid-19, days on market, downsizing, downtown, eatons lofts, exclusive, fall, fall market, fall update, february, federal home buyers program, first time buyer, fixed rates, for sale, free house evaluation, government, HBTC, hiring a realtor, home, home buying, home energy, home energy audit, home evaluation, home inspectors, home insurance rebate., home maintenance, home prices, home sales, home selling, home value, house, house prices, house value, housing grants, kaufman, kaufman lofts, kevin baker, kitchener, Kitchener Waterloo, ktichener, kwhometeam, land transfer tax, landlord, landlords, lawyers, lending, license, loft, loft apartments, loft buying, loft prices, loft sales, loft selling, lofts, mansion, mansion lofts, mansion7, march update, market, market anaylsis, market update, market value, may condo sales, mls, MLTT, momentum, momentum developeres, mortage rates, mortgage, mortgage brokers, mortgage news, mortgage rates, mortgage renewal, mortgage rules, mortgages, mulitiple listing service, new construction, newspaper ads, november update, ontario, open house, options for homes, paperwork, park, prices, prime rate, private, rates, rbc, re/max, real estaet, real estate, real estate agent, real estate investment, realtor, realty, reamx, red condo, red condos, remax, remax agent, remax twin city, remax twin city realty, royal bank, rrsp, rules, sale, sales rep, sales representative, sales reps, seagrams, seagrams lofts, segrams, Sellers, selling my condo, selling your home, september, special assessement, spring market, status, status certificate, street, student, summer market, tanglewood condo, tax refund, TD Bank, to do list, twin city, twin city realty, twin city reatly, update, updated, updates, value, variable rates, victoria commons, virus, waterloo, waterloo home sales, waterloo regiion, waterloo region, winter, winter market, yogi bednjicki | Leave a comment
Hope you enjoyed a wonderful Canada Day, and are staying cool during our summer heat wave! The spring market may have been delayed due to Covid 19 but it has sprung back in a big way in June.
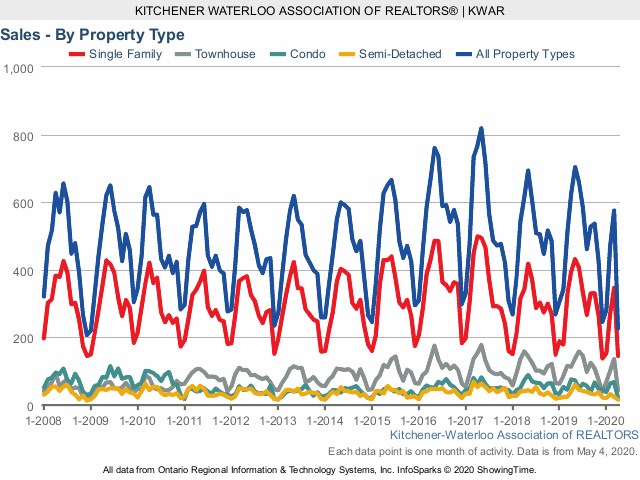
The number of homes sold in June shot up 57.6 per cent compared to May. There were 673 residential homes sold in June 2020, an increase of 2.1 per cent compared to June 2019, and an increase of 8.5 per cent compared to the previous 10-year average for June.
Total residential sales in June included 413 detached homes (up 1.7 per cent from June 2019), and 67 condominium apartments (up 36.7 per cent). Sales also included 134 townhouses (down 15.7 per cent) and 59 semi-detached homes (up 31.1 per cent).
Total residential sales during this second quarter (April, May, June) are down 33 per cent compared to last year. On a year-to-date basis, they are down 15.6 per cent.
I expect for the remainder of 2020 will see the number of home sales returning to near historical levels. There will be some catching up to do in the coming weeks, but I don’t think you will see the market taking the summer off.
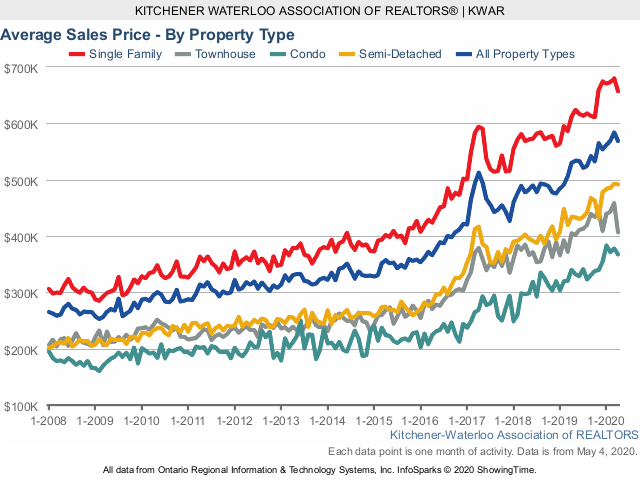
The average sale price of all residential properties sold in June increased 12.8 per cent to $601,285 compared to the same month last year, while detached homes sold for an average price of $698,736 an increase of 13.2 per cent. During this same period, the average sale price for an apartment-style condominium was $372,392 for an increase of 13.2 per cent. Townhomes and semis sold for an average of $457,851 (up 11.4 per cent) and $504,816 (up 17.3 per cent) respectively.
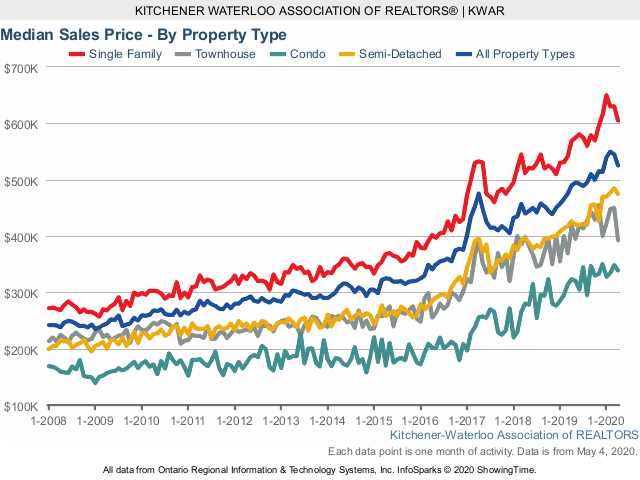
The median price of all residential properties sold in June increased 14.4 per cent to $564,000 and the median price of a detached home during the same period increased 11.9 per cent to $650,000.
There were 920 new listings added in KW and area last month, the most added in a single month since May of last year, and 1.9 per cent more than the previous ten-year average for June.
The total number of homes available for sale in active status at the end of June was 640, a decrease of 28.7 per cent compared to June of last year.
The number of Months Supply (also known as absorption rate) continues to be very low at just 1.4 months for the month of June, 22.2 per cent below the same period last year. The previous ten-year average supply of homes for June was 3.22 months, and in the past 5 years, the average supply for June was 2.22 months.
The average days to sell in June was 16 days, compared to 20 days in June 2019.
Historical Sales By Property Type
Months Supply of Homes for Sale

Historical Median Sales Price – By Property Type

Historical Average Sales Price – By Property Type

Historical Sales – By Price Range

Average Days on Market

If you are thinking of buying or selling in the coming months or have any questions at all, give me a call, text at 519-497-4646 or shoot me an email to kevinbaker@kwhometeam.ca Stay healthy and stay safe!
Have a great week!
Kevin
July 8, 2020 | Categories: Buyers, Kitchener Waterloo, Loft Style, New Construction, Sellers, Uncategorized | Tags: 1 victoria, 100 garment, 100 victoria, 144 park, 42 bridgeport, 85 duke, agent, agents, april, arrow, arrow lofts, assessment, assessment value, bank of canada, banks, barra condos, bauer, bauer lofts, big banks, blackberry, Buyers, bylaw, cambridge, canada trust, canadian mortgage housing corporation, carbon monoxide, charlie west, CHMC, cibc, city center, city center lofts, city centre, city centre condo, city centre condos, closing costs, closing paperwork, CMHC, condo, condo buyer, condo buying, condo costs, condo lofts, condo prices, condo sales, condo selling, condo unit, condo units, condo update, condo value, condominiums, condos, condos for sale, contribution, corona, covid, covid-19, days on market, downsizing, downtown, eatons lofts, exclusive, fall, fall market, fall update, february, federal home buyers program, first time buyer, fixed rates, for sale, free house evaluation, government, HBTC, hiring a realtor, home, home buying, home energy, home energy audit, home evaluation, home inspectors, home insurance rebate., home maintenance, home prices, home sales, home selling, home value, house, house prices, house value, housing grants, kaufman, kaufman lofts, kevin baker, kitchener, Kitchener Waterloo, ktichener, kwhometeam, land transfer tax, landlord, landlords, lawyers, lending, license, loft, loft apartments, loft buying, loft prices, loft sales, loft selling, lofts, mansion, mansion lofts, mansion7, march update, market, market anaylsis, market update, market value, may condo sales, mls, MLTT, momentum, momentum developeres, mortage rates, mortgage, mortgage brokers, mortgage news, mortgage rates, mortgage renewal, mortgage rules, mortgages, mulitiple listing service, new construction, newspaper ads, november update, ontario, open house, options for homes, paperwork, park, prices, prime rate, private, rates, rbc, re/max, real estaet, real estate, real estate agent, real estate investment, realtor, realty, reamx, red condo, red condos, remax, remax agent, remax twin city, remax twin city realty, royal bank, rrsp, rules, sale, sales rep, sales representative, sales reps, seagrams, seagrams lofts, segrams, Sellers, selling my condo, selling your home, september, special assessement, spring market, status, status certificate, street, student, summer market, tanglewood condo, tax refund, TD Bank, to do list, twin city, twin city realty, twin city reatly, update, updated, updates, value, variable rates, victoria commons, virus, waterloo, waterloo home sales, waterloo regiion, waterloo region, winter, winter market, yogi bednjicki | Leave a comment
Well its been a crazy couple of months across the globe as well as here in Waterloo Region. The Real Estate Market slowed considerably in April, but has seemed to bounce back in May. Even though we are down 40.5 percent compared to May of last year, home sales are up 80 percent compared to April 2020 with 419 Residential homes sold through the MLS system.
Total residential sales in May included 255 detached homes (down 41 per cent from May 2019), and 42 condominium apartments (down 42.5 per cent). Sales also included 79 townhouses (down 42.8 per cent) and 43 semi-detached homes (down 29.5 per cent).
The average sale price of all residential properties sold in May increased 6.5 per cent to $568,275 compared to the same month last year, while detached homes sold for an average price of $657,274 an increase of 5.4 per cent. During this same period, the average sale price for an apartment-style condominium was $330,336 for an increase of 0.6 per cent. Townhomes and semis sold for an average of $454,197 (up 13 per cent) and $482,479 (up 11.4 per cent) respectively.
The median price of all residential properties sold in May increased 10.1 per cent to $545,000 and the median price of a detached home during the same period increased 9.6 per cent to $630,000.
The demand for homes in the Kitchener-Waterloo area is still very much alive, but as the virus continued to circulate in the community many would-be sellers were reluctant to put their homes on the market. For the homebuyers who cannot wait out the pandemic, they are not finding any fire sales as homes are not only maintaining their value, but also increasing.
There were 577 new listings added to the MLS® System in KW and area last month, a decrease of 48.7 per cent compared to May of 2019, far fewer than the previous 10-year average of 1,035 listings in May.
The total number of homes available for sale in active status at the end of May was 567, a decrease of 43.9 per cent compared to May of last year.
The number of Months Supply (also known as absorption rate) continues to be very low at just 1.3 months for the month of May, 38.1 per cent below the same period last year. The previous ten-year average supply of homes for May was 3.25 months, and in the past 5 years, the average supply for May was 2.32 months.
Yogi and I have addopted all the tools and technology to help both buyers and sellers stay safe during the pandemic, while helping people keep their plans intact. Our goal first and foremost is to keep everyone safe by limiting physical contact, practicing social distancing and keeping buyers showings limited to 3 people at a time with no children present during showings. We are here to help as life moves forward.
Here are some charts to on sales by type, months of supply and average prices.
Historical Sales by Property Type

Months Supply of Homes for Sale

Historical Median Sales Price – By Property Type

Historical Average Sales Price – By Property Type

Historical Sales – By Price Range

Average Days on Market

If you have any questions or concerns at all, give me a call or text at 519-497-4646 or shoot me an email to kevinbaker@kwhometeam.ca . Stay healthy and stay safe!
Have a great week!
Kevin
June 3, 2020 | Categories: Buyers, Kitchener Waterloo, Loft Style, New Construction, Sellers, Uncategorized | Tags: 1 victoria, 144 park, 42 bridgeport, 85 duke, agent, agents, april, arrow, arrow lofts, assessment, assessment value, bank of canada, banks, bauer, bauer lofts, big banks, blackberry, Buyers, bylaw, cambridge, canada trust, canadian mortgage housing corporation, carbon monoxide, charlie west, CHMC, cibc, city center, city center lofts, city centre, city centre condo, city centre condos, closing costs, closing paperwork, CMHC, condo, condo buyer, condo buying, condo costs, condo lofts, condo prices, condo sales, condo selling, condo unit, condo units, condo update, condo value, condominiums, condos, condos for sale, contribution, corona, covid, covid-19, days on market, downsizing, downtown, eatons lofts, exclusive, fall, fall market, fall update, february, federal home buyers program, first time buyer, fixed rates, for sale, free house evaluation, government, HBTC, hiring a realtor, home, home buying, home energy, home energy audit, home evaluation, home inspectors, home insurance rebate., home maintenance, home prices, home sales, home selling, home value, house, house prices, house value, housing grants, kaufman, kaufman lofts, kevin baker, kitchener, Kitchener Waterloo, ktichener, kwhometeam, land transfer tax, landlord, landlords, lawyers, lending, license, loft, loft apartments, loft buying, loft prices, loft sales, loft selling, lofts, mansion, mansion lofts, mansion7, march update, market, market anaylsis, market update, market value, may condo sales, mls, MLTT, momentum, momentum developeres, mortage rates, mortgage, mortgage brokers, mortgage news, mortgage rates, mortgage renewal, mortgage rules, mortgages, mulitiple listing service, new construction, newspaper ads, november update, ontario, open house, options for homes, paperwork, park, prices, prime rate, private, rates, rbc, re/max, real estaet, real estate, real estate agent, real estate investment, realtor, realty, reamx, red condo, red condos, remax, remax agent, remax twin city, remax twin city realty, royal bank, rrsp, rules, sale, sales rep, sales representative, sales reps, seagrams, seagrams lofts, segrams, Sellers, selling my condo, selling your home, september, special assessement, spring market, status, status certificate, street, student, summer market, tanglewood condo, tax refund, TD Bank, to do list, twin city, twin city realty, twin city reatly, update, updated, updates, value, variable rates, victoria commons, virus, waterloo, waterloo home sales, waterloo regiion, waterloo region, winter, winter market, yogi bednjicki | Leave a comment
Hope you have been staying safe during the past 2 months. It looks like things will start to open back up in stages and at some point things will be hopefully back to normal. Rest assured Yogi and I are here to help if you and your family need to make a move and we have the tools and systems in place for both buyers and sellers for proper marketing of our listings, getting buyers to view the properties, as well as ourselves to keep everyone safe.
I thought you would like an update on what is happening out there in the Waterloo Region Real Estate Market, so here are the stats for April.
There were 227 residential homes sold through the Multiple Listing System in April, a decrease of 63.6 per cent compared to the same month last year, and the lowest number of sales in a single month since December 2008.
I think it goes without saying the current pandemic has had a major impact on the number of sales we would normally see in April, with everyone doing their part to flatten the curve and doing their best to self-isolate, the buying and selling of homes have been greatly reduced.
Total residential sales in April included 145 detached homes (down 63.3 per cent), and 22 condominium apartments (down 71.1 per cent). Sales also included 44 townhouses (down 61.1 per cent) and 16 semi-detached homes (down 60 per cent).
The average sale price of all residential properties sold in April increased 7.3 per cent to $568,738 compared to the same month last year, while detached homes sold for an average price of $657,042 an increase of 7.3 per cent. During this same period, the average sale price for an apartment-style condominium was $367,230 for an increase of 8.1 per cent. Townhomes and semis sold for an average of $406,463 (up 0.4 per cent) and $491,816 (up 13.3 per cent) respectively.
The median price of all residential properties sold in April increased by 7.1 per cent to $525,000 and the median price of a detached home during the same period increased 6.3 per cent to $605,000.
There were 417 new listings added to the MLS® System in KW and area last month, a decrease of 54.8 per cent compared to April of 2019, far fewer than the previous 10-year average of 937 listings in April.
The total number of homes available for sale in active status at the end of April was 571, a decrease of 36.6 per cent compared to April of last year.
The number of Months Supply (also known as absorption rate) continues to be very low at just 1.2 months for the month of April, 36.8 per cent below the same period last year. The previous ten-year average supply of homes for April was 2.95 months, and in the past 5 years, the average supply for April was 2.12 months.
I am confident that despite the current pandemic, the slowdown in housing sales will be temporary. We are still in a strong sellers’ market and with buyers competing for a scare number of listings, now is still a great time to buy. Now for the first time in a long time, April saw some balance with a sales-to-new-listings ratio of 54 percent – well within the balanced threshold. I have talked to some buyers expecting homes to sell at greatly reduced amounts, and frankly, that’s simply not the case. Home values have remained stable which I expect will continue into 2020.
The average days to sell in April was 19 days, compared to 21 days in April 2019.
Historical Sales By Property Type
Months Supply of Homes for Sale

Historical Median Sales Price – By Property Type
Historical Average Sales Price – By Property Type
Historical Sales – By Price Range
Average Days on Market

If you have any questions or concerns at all, give me a call or text at 519-497-4646 or shoot me an email to kevinbaker@kwhometeam.ca . Stay healty and stay safe!
Have a great week!
Kevin
May 5, 2020 | Categories: Buyers, Kitchener Waterloo, Loft Style, New Construction, Sellers | Tags: 1 victoria, 100 garment, 100 victoria, 144 park, 42 bridgeport, 85 duke, agent, agents, april, arrow, arrow lofts, assessment, assessment value, bank of canada, banks, barra condos, bauer, bauer lofts, big banks, blackberry, Buyers, bylaw, cambridge, canada trust, canadian mortgage housing corporation, carbon monoxide, charlie west, CHMC, cibc, city center, city center lofts, city centre, city centre condo, city centre condos, closing costs, closing paperwork, CMHC, condo, condo buyer, condo buying, condo costs, condo lofts, condo prices, condo sales, condo selling, condo unit, condo units, condo update, condo value, condominiums, condos, condos for sale, contribution, corona, covid, covid-19, days on market, downsizing, downtown, eatons lofts, exclusive, fall, fall market, fall update, february, federal home buyers program, first time buyer, fixed rates, for sale, free house evaluation, government, HBTC, hiring a realtor, home, home buying, home energy, home energy audit, home evaluation, home inspectors, home insurance rebate., home maintenance, home prices, home sales, home selling, home value, house, house prices, house value, housing grants, kaufman, kaufman lofts, kevin baker, kitchener, Kitchener Waterloo, ktichener, kwhometeam, land transfer tax, landlord, landlords, lawyers, lending, license, loft, loft apartments, loft buying, loft prices, loft sales, loft selling, lofts, mansion, mansion lofts, mansion7, march update, market, market anaylsis, market update, market value, may condo sales, mls, MLTT, momentum, momentum developeres, mortage rates, mortgage, mortgage brokers, mortgage news, mortgage rates, mortgage renewal, mortgage rules, mortgages, mulitiple listing service, new construction, newspaper ads, november update, ontario, open house, options for homes, paperwork, park, prices, prime rate, private, rates, rbc, re/max, real estaet, real estate, real estate agent, real estate investment, realtor, realty, reamx, red condo, red condos, remax, remax agent, remax twin city, remax twin city realty, royal bank, rrsp, rules, sale, sales rep, sales representative, sales reps, seagrams, seagrams lofts, segrams, Sellers, selling my condo, selling your home, september, special assessement, spring market, status, status certificate, street, student, summer market, tanglewood condo, tax refund, TD Bank, to do list, twin city, twin city realty, twin city reatly, update, updated, updates, value, variable rates, victoria commons, virus, waterloo, waterloo home sales, waterloo regiion, waterloo region, winter, winter market, yogi bednjicki | Leave a comment
Hope you have been staying safe during this unique time in all our lives. Rest assured Yogi and I are doing everthing we can to prevent the spread by staying home as much as posssible and limiting client interactions to phone calls, facetime, zoom meetings, etc. We are both here to help if you and your family need to make a move and we have the tools and systems in place for both buyers and sellers for proper marketing of our listings, getting buyers to view the properties, as well as ourselves to keep everyone safe.
I thought you would like an update on what is happening out there in the Waterloo Region Real Estate Market, so here are the stats for March.
There were 577 residential homes sold in March, an increase of 13.1 per cent compared to the same month last year, and 0.2 per cent below the previous 5-year average.
During the first quarter of 2020, there were 1,327 home sales, 14.6 per cent above last year’s result for the same period and 4 per cent above the previous 5-year average.
Total residential sales in March included 348 detached homes (up 7.1 per cent), and 68 condominium apartments (up 5.1 per cent). Sales also included 136 townhouses (up 17.2 per cent) and 25 semi-detached homes (up 4.2 per cent).
The average sale price of all residential properties sold in March increased 15.3 per cent to $583,752 compared to the same month last year, while detached homes sold for an average price of $679,728 an increase of 15.9 per cent. During this same period, the average sale price for an apartment-style condominium was $378,443 for an increase of 17.9 per cent. Townhomes and semis sold for an average of $457,547 (up 23 per cent) and $492,752 (up 17.4 per cent) respectively.
The median price of all residential properties sold in March increased 14.6 per cent to $544,500 and the median price of a detached home during the same period increased 16.2 per cent to $628,500.
Now of course is this not business as usual for us as Realtors or our clients. As people everywhere follow instructions to only leave their homes for essential reasons, this is impacting the number of showings, and how properties are shown.
There were a higher than average number of homes listed during the Month of March. There were 864 new listings added to the MLS® System in KW and area last month, an increase of 7.6 per cent compared to March of 2019, and the greatest number since 2015. The number of new residential listings was also 3.7 per cent higher than the previous ten-year average for March.
The total number of homes available for sale in active status at the end of March was 535, a decrease of 35.9 per cent compared to March of last year.
Despite the much-needed addition of new inventory coming to the market, the number of Months Supply (also known as absorption rate) continues to be very low at just 1.1 months for the month of March, 35.3 per cent below the same period last year. The previous ten-year average supply of homes for March was 2.73 months, and in the past 5 years, the average supply for March was 1.94 months.
There were also 51 listings last month that were suspended, which means the listing is temporarily “off-market,” and there can be no marketing, showings or offers during this period.
Trying to sell your home while in quarantine, self-isolating or worse yet, while someone in the house is sick, is not going to be in anyone’s best interest. We know many people are postponing their plans to list their home for the time being. As I mentioned earlier, if you find yourself in a situation where you need to buy or sell then rest assured Yogi and I are ready to help and have the tools in place to market, show and sell your home. The number of sales is keeping pace with the new listing inventory so there are still buyers out there looking to buy. We are doing everything we can to keep everyone safe during this time.
Historical Sales By Property Type

Months Supply of Homes for Sale

Historical Median Sales Price – By Property Type

Historical Average Sales Price – By Property Type

Historical Sales – By Price Range

Average Days on Market

If you have any questions or concerns at all, give me a call or text at 519-497-4646 or shoot me an email to kevinbaker@kwhometeam.ca . Stay healty and stay safe!
Have a great weekend
Kevin
April 4, 2020 | Categories: Buyers, Kitchener Waterloo, Loft Style, New Construction, Sellers, Uncategorized | Tags: 1 victoria, 100 garment, 100 victoria, 144 park, 42 bridgeport, 85 duke, agent, agents, april, arrow, arrow lofts, assessment, assessment value, bank of canada, banks, barra condos, bauer, bauer lofts, big banks, blackberry, Buyers, bylaw, cambridge, canada trust, canadian mortgage housing corporation, carbon monoxide, charlie west, CHMC, cibc, city center, city center lofts, city centre, city centre condo, city centre condos, closing costs, closing paperwork, CMHC, condo, condo buyer, condo buying, condo costs, condo lofts, condo prices, condo sales, condo selling, condo unit, condo units, condo update, condo value, condominiums, condos, condos for sale, contribution, corona, covid, covid-19, days on market, downsizing, downtown, eatons lofts, exclusive, fall, fall market, fall update, february, first time buyer, fixed rates, for sale, free house evaluation, government, HBTC, hiring a realtor, home, home buying, home energy, home energy audit, home evaluation, home inspectors, home insurance rebate., home maintenance, home prices, home sales, home selling, home value, house, house prices, house value, housing grants, kaufman, kaufman lofts, kevin baker, kitchener, Kitchener Waterloo, ktichener, kwhometeam, land transfer tax, landlord, landlords, lawyers, lending, license, loft, loft apartments, loft buying, loft prices, loft sales, loft selling, lofts, mansion, mansion lofts, mansion7, march update, market, market anaylsis, market update, market value, may condo sales, mls, MLTT, momentum, momentum developeres, mortage rates, mortgage, mortgage brokers, mortgage news, mortgage rates, mortgage renewal, mortgage rules, mortgages, mulitiple listing service, new construction, newspaper ads, november update, ontario, open house, options for homes, paperwork, park, prices, prime rate, private, rates, rbc, re/max, real estaet, real estate, real estate agent, real estate investment, realtor, realty, reamx, red condo, red condos, remax, remax agent, remax twin city, remax twin city realty, royal bank, rrsp, rules, sale, sales rep, sales representative, sales reps, seagrams, seagrams lofts, segrams, Sellers, selling my condo, selling your home, september, special assessement, spring market, status, status certificate, street, student, summer market, tanglewood condo, tax refund, TD Bank, to do list, twin city, twin city realty, update, updated, updates, value, variable rates, virus, waterloo, waterloo home sales, waterloo regiion, waterloo region, winter, winter market, yogi bednjicki | Leave a comment
I hope you and your family are staying safe and home isolating during these unique and trying times. I am postive that we will come through this stronger and hopefully not take for granted that with friends or dinners out with the family.
I have had several clients and friends reach out to me on what is happening in our current real estate market, so i thought i would put together a couple of brief slides to show you what is currently happening. With everyone being asked to stay home obviously the market has seen slowing of showing activity for homes that are currently on the market. We have also seen a slow down of new listings that have hit the Mls system for Waterloo region.
In the past 10-14 days the showings have dropped off considerably which would be expected given what is happening. This is an Ontairo slide but is very reflective of our local market as well.
Now does that mean that homes are not selling? No, that is not true.. Homes are selling but things are taking a little bit longer than usual and not the “norm” that we have seen over the past 5 years. There are still people that have bought a home prior to this all happening and need to sell their existing home. There are also people that have sold their home and need to buy their next one.
We are still seeing subdued showing activity and have taken strong measures to help both buyers and sellers stay safe when an in person showing is necessary. Buyers are also using current technology such as virtural tours and facetime walk throughts etc. Our first priority is to make sure that our clients and ourselves are staying healthy and safe.
Below is a graph of last weeks activity on our Waterloo Region Real Estate Board.
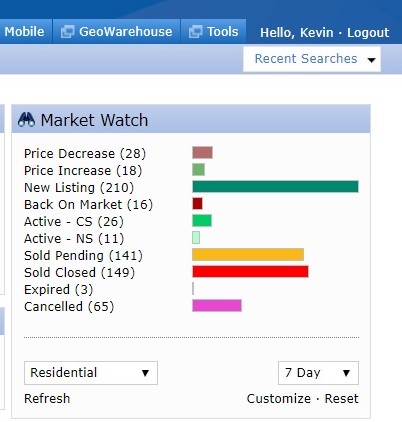
You can see that there were 141 sales last week, which means homes that had offers on them firmed up or had offers come in that had no conditions. There are 37 homes that received offers with conditions that were accepted and 210 new listings hit the market. The closed sales are homes that were sold firm in the past months that closed and the buyers took posession. There were also 65 cancelations which are sellers that may have taken them off the market for now due to lack of activity or Covid 19.
I hope that you find this info helpful to answer any questions or concerns that you are been thinking about during your time at home. As always feel free to reach via text or phone at 519-497-4646, messanger on facebook or we can talk on skype etc. We are not doing an in person meetings during this time and we also utitlze electionic signatures for paperwork that is needed to be completed or for listing a home etc.
It may not be “business as usual” but as an essential service we are open for business. Luckily we can do most of our business from home and online when needed to do so. We are here to help.
Have a great weekend and stay safe.
Kevin
March 28, 2020 | Categories: Buyers, Kitchener Waterloo, Loft Style, New Construction, Sellers, Uncategorized | Tags: 1 victoria, 100 garment, 100 victoria, 144 park, 42 bridgeport, 85 duke, agent, agents, april, arrow, arrow lofts, assessment, assessment value, bank of canada, banks, barra condos, bauer, bauer lofts, big banks, blackberry, Buyers, bylaw, cambridge, canada trust, canadian mortgage housing corporation, carbon monoxide, charlie west, CHMC, cibc, city center, city center lofts, city centre, city centre condo, city centre condos, closing costs, closing paperwork, CMHC, condo, condo buyer, condo buying, condo costs, condo lofts, condo prices, condo sales, condo selling, condo unit, condo units, condo update, condo value, condominiums, condos, condos for sale, contribution, corona, covid, covid-19, days on market, downsizing, downtown, eatons lofts, exclusive, fall, fall market, fall update, february, federal home buyers program, first time buyer, fixed rates, for sale, free house evaluation, government, HBTC, hiring a realtor, home, home buying, home energy, home energy audit, home evaluation, home inspectors, home insurance rebate., home maintenance, home prices, home sales, home selling, home value, house, house prices, house value, housing grants, kaufman, kaufman lofts, kevin baker, kitchener, Kitchener Waterloo, ktichener, kwhometeam, land transfer tax, landlord, landlords, lawyers, lending, license, loft, loft apartments, loft buying, loft prices, loft sales, loft selling, lofts, mansion, mansion lofts, mansion7, march update, market, market anaylsis, market update, market value, may condo sales, mls, MLTT, momentum, momentum developeres, mortage rates, mortgage, mortgage brokers, mortgage news, mortgage rates, mortgage renewal, mortgage rules, mortgages, mulitiple listing service, new construction, newspaper ads, november update, ontario, open house, options for homes, paperwork, park, prices, prime rate, private, rates, rbc, re/max, real estaet, real estate, real estate agent, real estate investment, realtor, realty, reamx, red condo, red condos, remax, remax agent, remax twin city, remax twin city realty, royal bank, rrsp, rules, sale, sales rep, sales representative, sales reps, seagrams, seagrams lofts, segrams, Sellers, selling my condo, selling your home, september, special assessement, spring market, status, status certificate, street, student, summer market, tanglewood condo, tax refund, TD Bank, to do list, twin city, twin city realty, twin city reatly, update, updated, updates, value, variable rates, victoria commons, virus, waterloo, waterloo home sales, waterloo regiion, waterloo region, winter, winter market, yogi bednjicki | Leave a comment
Hope you have been enjoying the mild winter we have been having so far even with the latest blast of snow. Spring is right around the corner along with the nice weather and very busy spring market. The stats for february are in it was another strong month of home sales here in Kitchener Waterloo.
There were 467 residential homes sold in February, an increase of 36.5 per cent compared to the same month last year, and 15.3 per cent above the previous 10-year average.
Total residential sales in February included 272 detached homes (up 52 per cent), and 62 condominium units (up 14.8 per cent) which includes any property regardless of style (i.e. semis, townhomes, apartment, detached etc.). Sales also included 32 semi-detached homes (up 33.3 per cent) and 101 freehold townhouses (up 18.8 per cent).
The average sale price of all residential properties sold in February increased 16.3 per cent to $571,023 compared to the same month last year, while detached homes sold for an average price of $673,825 an increase of 13.2 per cent. During this same period, the average sale price for an apartment-style condominium was $371,923 for an increase of 16.4 per cent. Townhomes and semis sold for an average of $443,382 (up 12.9 per cent) and $485,831 (up 8.4 per cent) respectively.
The median price of all residential properties sold in February increased 18.2 per cent to $550,050 and the median price of a detached home during the same period increased 18.6 per cent to $630,000.
Like many other markets across the province, the story of our local housing market continues to be one of supply and demand. Market-wide, the number of homes available for sale is simply not keeping up with the number of people wanting to purchase a home in the Kitchener-Waterloo area.
There were 609 residential properties listed in KW and area last month, an increase of 7.8 per cent compared to February of 2019, and a decrease of 5.9 per cent in comparison to the previous ten-year average for February. The total number of homes available for sale in active status at the end of February was 447, a decrease of 39.4 per cent compared to February of last year, and 62 per cent below the previous ten-year average of 1,179 listings for February. The number of Months Supply (also known as absorption rate) in February was just 0.9 months, 40 per cent below the same period last year. The previous ten-year average supply of homes for February was 2.55 months, and in the past 5 years the average supply for February was 1.76 months.
With a multitude of buyers jumping on a scarcity of properties for sale, many homes are selling for more than the asking price. Using a realtor will ensure you have maximum exposure to these buyers through the MLS® System and will manage the intricate process of any multiple offers professionally.
The average days to sell in February was 17 days, compared to 26 days in February 2019.
Historical Sales By Property Type

Months Supply of Homes for Sale

Historical Median Sales Price – By Property Type

Historical Average Sales Price – By Property Type

Historical Sales – By Price Range

Average Days on Market

If you have any questions or have been thinking of making a move this spring, give me a call or text at 519-497-4646 or shoot me an email to kevinbaker@kwhometeam.ca . Now is a fantastic time to get top dollar for your home so lets sit down, grab a coffee and plan out a strategy that is best suited for your families needs.
Have a great weekend
Kevin
March 7, 2020 | Categories: Buyers, Kitchener Waterloo, Loft Style, New Construction, Sellers, Uncategorized | Tags: 1 victoria, 100 garment, 100 victoria, 144 park, 42 bridgeport, 85 duke, agent, agents, april, arrow, arrow lofts, assessment, assessment value, bank of canada, banks, barra condos, bauer, bauer lofts, big banks, blackberry, Buyers, bylaw, cambridge, canada trust, canadian mortgage housing corporation, carbon monoxide, charlie west, CHMC, cibc, city center, city center lofts, city centre, city centre condo, city centre condos, closing costs, closing paperwork, CMHC, condo, condo buyer, condo buying, condo costs, condo lofts, condo prices, condo sales, condo selling, condo unit, condo units, condo update, condo value, condominiums, condos, condos for sale, contribution, days on market, downsizing, downtown, eatons lofts, exclusive, fall, fall market, fall update, february, federal home buyers program, first time buyer, fixed rates, for sale, free house evaluation, government, HBTC, hiring a realtor, home, home buying, home energy, home energy audit, home evaluation, home inspectors, home insurance rebate., home maintenance, home prices, home sales, home selling, home value, house, house prices, house value, housing grants, kaufman, kaufman lofts, kevin baker, kitchener, Kitchener Waterloo, ktichener, kwhometeam, land transfer tax, landlord, landlords, lawyers, lending, license, loft, loft apartments, loft buying, loft prices, loft sales, loft selling, lofts, mansion, mansion lofts, mansion7, march update, market, market anaylsis, market update, market value, may condo sales, mls, MLTT, momentum, momentum developeres, mortage rates, mortgage, mortgage brokers, mortgage news, mortgage rates, mortgage renewal, mortgage rules, mortgages, mulitiple listing service, new construction, newspaper ads, november update, ontario, open house, options for homes, paperwork, park, prices, prime rate, private, rates, rbc, re/max, real estaet, real estate, real estate agent, real estate investment, realtor, realty, reamx, red condo, red condos, remax, remax agent, remax twin city, remax twin city realty, royal bank, rrsp, rules, sale, sales rep, sales representative, sales reps, seagrams, seagrams lofts, segrams, Sellers, selling my condo, selling your home, september, special assessement, spring market, status, status certificate, street, student, summer market, tanglewood condo, tax refund, TD Bank, to do list, twin city, twin city realty, twin city reatly, update, updated, updates, value, variable rates, victoria commons, waterloo, waterloo home sales, waterloo regiion, waterloo region, winter, winter market, yogi bednjicki | Leave a comment
Hope you have been enjoying the mild winter we have been having so far and Valentines day is just around the corner. The January market stats are out and it seems like the trend we have been seeing in the market is continuing once again.
There were 281 residential homes sold in January, a decrease of 8.2 per cent compared to the previous month. Contrasted to previous Januarys however, home sales last month were only 3.6 per cent below the previous 10-year average, and 3.8 per cent below the previous 5-year average.
For the third consecutive month sales were down in January, which is a direct result of fewer homes being put up for sale. This is causing further price acceleration as we have enough willing and able home buyers contending for those few homes that are available.
Total residential sales in January included 153 detached homes (down 19 per cent), and 39 condominium units (up 18.2 per cent) which includes any property regardless of style (i.e. semis, townhomes, apartment, detached etc.). Sales also included 21 semi-detached homes (on par) and 68 freehold townhouses (up 7.9 per cent).
The average sale price of all residential properties sold in January increased 15.7 per cent to $561,029 compared to the same month last year, while detached homes sold for an average price of $670,944 an increase of 18.8 per cent. During this same period, the average sale price for an apartment-style condominium was 382,636 for an increase of 26.1 per cent. Townhomes and semis sold for an average of $439,765 (up 20.3 per cent) and $484,190 (up 18.7 per cent) respectively.
The median price of all residential properties sold in January increased 17.3 per cent to $536,000 and the median price of a detached home during the same period increased 22.6 per cent to $650,000.
Buyer’s can’t buy what’s not there. The available number of homes for sale, or lack thereof, continued to evade home buyers in January. There is no doubt we would be reporting more sales if we had the inventory to match the demand.
There were 464 residential properties listed in KW and area last month, a drop of 21.1 per cent compared to January of 2019, and a decrease of 35.4 per cent in comparison to the previous ten-year average for January. The total number of homes available for sale in active status at the end of January was 392, a decrease of 38.7 per cent compared to January of last year, and 63.7 per cent below the previous ten-year average of 1,080 listings for January. The number of Months Supply (also known as absorption rate) in January was just 0.8 months, 38.5 per cent below the same period last year. The previous ten-year average supply of homes for January was 2.32 months, however, in the past 5 years the average supply for January was 1.96 months.
The average days to sell in January was 22 days, compared to 27 days in January 2019.
Historical Sales By Property Type
Months Supply of Homes for Sale
Historical Median Sales Price – By Property Type
Historical Average Sales Price – By Property Type
Historical Sales – By Price Range
Average Days on Market
If you have any questions or have been thinking of making a move this spring, give me a call or text at 519-497-4646 or shoot me an email to kevinbaker@kwhometeam.ca . Now is a fantastic time to get top dollar for your home so lets sit down, grab a coffee and plan out a strategy that is best suited for your families needs.
Have a great Valentines Day!
Kevin
February 6, 2020 | Categories: Buyers, Kitchener Waterloo, Loft Style, New Construction, Sellers, Uncategorized | Tags: 1 victoria, 100 garment, 100 victoria, 144 park, 42 bridgeport, 85 duke, agent, agents, arrow, arrow lofts, assessment, assessment value, bank of canada, banks, barra condos, bauer, bauer lofts, big banks, blackberry, Buyers, bylaw, cambridge, canada trust, carbon monoxide, charlie west, CHMC, cibc, city center, city center lofts, city centre, city centre condo, city centre condos, closing costs, closing paperwork, CMHC, condo, condo buyer, condo buying, condo costs, condo lofts, condo prices, condo sales, condo selling, condo unit, condo units, condo update, condo value, condominiums, condos, condos for sale, contribution, days on market, downsizing, downtown, eatons lofts, exclusive, fall update, february, federal home buyers program, first time buyer, fixed rates, for sale, free house evaluation, government, hiring a realtor, home, home buying, home energy, home energy audit, home evaluation, home inspectors, home insurance rebate., home maintenance, home prices, home sales, home selling, home value, house, house prices, house value, housing grants, kaufman, kaufman lofts, kevin baker, kitchener, Kitchener Waterloo, ktichener, kwhometeam, land transfer tax, landlord, landlords, lawyers, lending, license, loft, loft apartments, loft buying, loft prices, loft sales, loft selling, lofts, mansion, mansion lofts, mansion7, market, market anaylsis, market update, market value, mls, momentum, momentum developeres, mortage rates, mortgage, mortgage brokers, mortgage news, mortgage rates, mortgage rules, mortgages, mulitiple listing service, newspaper ads, november update, ontario, open house, options for homes, paperwork, park, prices, prime rate, private, rates, rbc, re/max, real estaet, real estate, real estate agent, real estate investment, realtor, realty, reamx, red condo, red condos, remax, remax agent, remax twin city, remax twin city realty, royal bank, rrsp, rules, sale, sales rep, sales representative, sales reps, seagrams, seagrams lofts, segrams, Sellers, selling my condo, selling your home, september, special assessement, spring market, status, status certificate, student, tax refund, TD Bank, to do list, twin city, twin city realty, twin city reatly, update, updated, updates, value, variable rates, victoria commons, waterloo, waterloo home sales, waterloo regiion, waterloo region, winter, winter market, yogi bednjicki | Leave a comment
Hope you had a wonderful Holiday season with your family! 2020 is here and if a new home is in the plans here are the stats from last year to help with your decision making process.
Sales dipped in December, while prices continue to escalate. There were 5,925 residential homes sold in 2019, an increase of 1.6 per cent compared to 2018. Contrasted to past years, 2019’s annual sales were 2.3 per cent below the previous 5-year average, and 3 per cent above the previous 10-year average.
On a monthly basis, sales dipped 9 percent compared to last year, with 244 home sales in the month of December.
Total residential sales in 2019 included 3,590 detached (up 5.9 per cent), and 648 condominium units (down 7.8 per cent) which includes any property regardless of style (i.e. semis, townhomes, apartment, detached etc.). Sales also included 421 semi-detached homes (down 0.7 per cent) and 1,266 freehold townhouses (down 3.7 per cent).
The average sale price of all residential properties sold in 2019 increased 9.3 per cent to $527,718 compared to 2018. Detached homes sold for an average price of $614,743 an increase of 7.1 per cent compared to 2018. During this same period, the average sale price for an apartment style condominium was 332,409 for an increase of 9.6 per cent. Townhomes and semis sold for an average of $409,979 (up 10 per cent) and $439,844 (up 11 per cent) respectively.
The median price of all residential properties sold last year increased 10.1 per cent to $490,000 and the median price of a detached home during the same period increased 8.6 per cent to $570,000.
In 2019, the lack of supply continued to be a hurdle for anyone who was trying to buy their first home, move-up from their current residence, or downsize. This ongoing state of the market caused further escalation of home prices in 2019. With interest rates expected to stay low in the year ahead combined with Waterloo region’s ongoing growth, I expect 2020 will see more price gains alongside a steady increase in sales.
The number of months of inventory averaged 1.5 throughout the year, hitting its highest point in May when there was 2.1 months of supply, and ending the year at 0.7 (3-4 months supply is historically normal for Waterloo region). The average days to sell in 2019 was 23 days, compared to 24 days in 2018 and a previous 10-year average of 38 days.
Dollar volume of all residential real estate sold last year increased 10.9 per cent to $3.1 Billion compared with 2018.
While the majority of residential MLS® System activity is properties for sale, REALTORS® are increasingly representing landlords and tenants. Last year 733 residential leases occurred through KWAR’s MLS® System, which is on par with last year and, 2.5 times as many as just four years ago.
Historical Sales by Property Type

Months Supply of Homes for Sale

Historical Median Sales Price – By Property Type

Average Sales Price – By Property Type

Historical Sales – By Price Range

Average Days on Market

If you have any questions or have been thinking of making a move this spring, give me a call or text at 519-497-4646 or shoot me an email to kevinbaker@kwhometeam.ca and lets sit down, grab a coffee and plan out a strategy that is best suited for your families needs.
Have a great January!
Kevin
January 6, 2020 | Categories: Buyers, Kitchener Waterloo, Loft Style, New Construction, Sellers, Uncategorized | Tags: agent, agents, arrow, assessment, bank of canada, banks, bauer, big banks, Buyers, cambridge, cibc, city center, city centre, closing costs, CMHC, condo, condo buying, condo prices, condo sales, condo units, condominiums, condos, condos for sale, days on market, downsizing, downtown, exclusive, fall market, for sale, government, home, home buying, home energy, home energy audit, home evaluation, home inspectors, home maintenance, home prices, home sales, home selling, home value, house, house prices, housing grants, kaufman, kitchener, Kitchener Waterloo, land transfer tax, landlord, landlords, lawyers, lending, license, loft, lofts, mansion, market, market update, market value, mls, momentum, mortage rates, mortgage, mortgage brokers, mortgage news, mortgage rates, mortgages, ontario, open house, park, prices, prime rate, private, rates, real estate, real estate agent, real estate investment, realtor, realty, remax, rrsp, rules, sale, sales rep, sales representative, sales reps, Sellers, selling your home, status, student, TD Bank, to do list, update, updates, value, waterloo, winter | Leave a comment
Hope you had a wonderful Halloween and here is hoping the snow stays away for a little while longer. I wanted to shoot you a quick update on how the real estate market did in November here in Waterloo Region.
There were 538 residential properties sold here in Kitchener-Waterloo in October, an increase of 4.1 per cent compared to the same month last year.
Home sales in October included 334 detached (up 11.3 per cent), and 65 condominium apartments (up 1.6 per cent). Sales also included 108 townhouses (down 6.1 per cent) and 31 semi-detached homes (down 18.4 per cent).
The average sale price of all residential properties sold in October increased by 9.1 per cent to $533,288 compared to October 2018. Detached homes sold for an average price of $610,840 (an increase of 6.2 per cent compared to October of last year. During this same period, the average sale price for an apartment-style condominium was $333,895 for an increase of 6.7 per cent. Townhomes and semis sold for an average of $434,035 (up 11.2 per cent) and $461,590 (up 14.3 per cent) respectively.
The median price of all residential properties sold last month increased 12.4 per cent to $500,000 and the median price of a detached home during the same period increased by 8.3 per cent to $568,950.
The average days it took to sell a home in October was 22 days, which is three days fewer than it took in October 2018.
There were 670 residential properties listed in K-W and area last month, a decrease of 12.4 per cent compared to October of 2018, and a decrease of 3.3 per cent in comparison to the previous ten-year average for the month of October. The total number of homes available for sale in active status at the end of October totalled 691, a decrease of 26.5 per cent compared to October of last year, and well below the previous ten-year average of 1,412 listings for October. Months Supply of Homes for sale stood at 1.4 months in October, which is 26.3 percent lower than the same period last year. The previous ten-year average months supply of homes for October was 3.03.
Seasonal strength in October is common as people to look to make moves before Winter. With a scarcity of listings, buyers continue to snap up properties in the Kitchener-Waterloo area at a fast pace.
Here are some charts….
Historical Sales by Property Type

Months Supply of Homes for Sale

Historical Median Sales Price – By Property Type

Average Sales Price – By Property Type
Historical Sales – By Price Range

Average Days on Market
If you have any questions or have been thinking of making a move this fall, give me a call or text at 519-497-4646 or shoot me an email to kevinbaker@kwhometeam.ca and lets sit down, grab a coffee and plan out a strategy that is best suited for your families needs.
Have a great November!
Kevin
November 5, 2019 | Categories: Buyers, Kitchener Waterloo, Loft Style, New Construction, Sellers, Uncategorized | Tags: 1 victoria, 100 garment, 100 victoria, 144 park, 42 bridgeport, 85 duke, agent, agents, arrow, arrow lofts, assessment, bank of canada, banks, barra condos, bauer, bauer lofts, big banks, blackberry, Buyers, bylaw, cambridge, canada trust, canadian mortgage housing corporation, carbon monoxide, charlie west, CHMC, cibc, city center, city center lofts, city centre, city centre condo, city centre condos, closing costs, CMHC, condo, condo buyer, condo buying, condo costs, condo lofts, condo prices, condo sales, condo selling, condo unit, condo units, condo update, condo value, condominiums, condos, condos for sale, contribution, days on market, downsizing, downtown, eatons lofts, exclusive, fall, fall market, fall update, first time buyer, fixed rates, for sale, government, HBTC, hiring a realtor, home, home buying, home energy, home energy audit, home inspectors, home insurance rebate., home maintenance, home prices, home sales, home selling, home value, house, house prices, house value, housing grants, kaufman, kaufman lofts, kevin baker, kitchener, Kitchener Waterloo, ktichener, land transfer tax, landlord, landlords, lawyers, lending, license, loft, loft apartments, loft prices, loft sales, loft selling, lofts, mansion, mansion lofts, mansion7, market, market anaylsis, market update, market value, mls, momentum, momentum developeres, mortage rates, mortgage, mortgage brokers, mortgage news, mortgage rates, mortgage renewal, mortgage rules, mortgages, mulitiple listing service, new construction, newspaper ads, november update, ontario, open house, options for homes, paperwork, park, prices, prime rate, private, rates, rbc, re/max, real estaet, real estate, real estate agent, real estate investment, realtor, realty, reamx, red condo, red condos, remax, remax agent, remax twin city, remax twin city realty, royal bank, rrsp, sale, sales rep, sales representative, sales reps, seagrams, seagrams lofts, segrams, Sellers, selling my condo, selling your home, september, special assessement, spring market, status, status certificate, street, summer market, tax refund, TD Bank, twin city, twin city reatly, update, updated, updates, value, variable rates, victoria commons, waterloo, waterloo home sales, waterloo regiion, waterloo region, winter, winter market, yogi bednjicki | Leave a comment
Hope you had a wonderful weekend. Back to school is here and I am sure all the kids have settled in and got the new school year underway. August was another great month for Waterloo region real estate and here are the stats to keep you right up to date.
There were 459 residential properties sold through the MLS® in August, a decrease of 9.1 per cent compared to the same month last year.
Home sales in August included 267 detached (down 11.9 per cent), and 56 condominium apartments (down 13.8 per cent). Sales also included 97 townhouses (down 4.9 per cent) and 39 semi-detached homes (up 11.4 per cent).
The number of homes sold last month was below the average for August; however, we continue to see strong price gains across all property types.
The average sale price of all residential properties sold in August increased by 6.4 per cent to $524,482 compared to August 2018. Detached homes sold for an average price of $615,568 (an increase of 5.4 per cent compared to August of last year. During this same period, the average sale price for an apartment-style condominium was $324,778 for a decrease of 3.1 per cent. Townhomes and semis sold for an average of $420,239 (up 18.3 per cent) and $441,802 (up 10.2 per cent) respectively.
The median price of all residential properties sold last month increased 8.1 per cent to $495,000 and the median price of a detached home during the same period increased by 2.8 per cent to $560,000.
There were 574 residential properties in K-W and area last month, a decrease of 14.5 per cent compared to August of 2018, and a decrease of 13 per cent in comparison to the previous ten-year average for the month of August. The total number of homes available for sale in active status at the end of August totalled 734, a decrease of 17.3 per cent compared to August of last year, and well below the previous ten-year average of 1,426 listings for August. Months Supply of Homes for sale stood at 1.5 months in August, which is 16.7 percent lower than the same period last year.
The average days it took to sell a home in August was 26 days, which is two days fewer than it took in August 2018.
We’re noting differences in market balance depending on the price range, for homes priced under $600 thousand, it is still a strong seller’s market, whereas above $600 thousand, it is a more balanced situation.
One this to look at is the month’s supply of homes, also known as the absorption rate. For homes priced at more than $600,000, the months of supply stood at 3.4 in August, compared to 0.9 months for homes prices under that amount. Months supply is the inventory of homes for sale at the end of a given month, divided by the average monthly closed sales from the last 12 months. The previous ten-year average months supply across all price ranges has been just over 3 months.
It all comes down to what the buyers can find in their price range, homes in Kitchener-Waterloo are definitely in high demand, and there is strong competition among buyers trying to find one that will suit them.
Historical Sales by Property Type

Months Supply of Homes for Sale

Historical Median Sales Price – By Property Type
Historical Average Sales Price – By Property Type

Historical Sales – By Price Range

Average Days on Market

If you have any questions or have been thinking of making a move this summer or into the fall, give me a call or text at 519-497-4646 or shoot me an email to kevinbaker@kwhometeam.ca and lets sit down, grab a coffee and plan out a strategy that is best suited for your families needs.
Have a great September!
Kevin
September 9, 2019 | Categories: Buyers, Kitchener Waterloo, Loft Style, New Construction, Sellers, Uncategorized | Tags: 1 victoria, 100 garment, 100 victoria, 144 park, 42 bridgeport, 85 duke, agent, agents, april, arrow, arrow lofts, assessment, assessment value, bank of canada, banks, barra condos, bauer, bauer lofts, big banks, blackberry, Buyers, bylaw, cambridge, canada trust, canadian mortgage housing corporation, carbon monoxide, charlie west, CHMC, cibc, city center, city center lofts, city centre, city centre condo, city centre condos, closing costs, closing paperwork, CMHC, condo, condo buyer, condo buying, condo costs, condo lofts, condo prices, condo sales, condo selling, condo unit, condo units, condo update, condo value, condominiums, condos, condos for sale, contribution, days on market, downsizing, downtown, eatons lofts, exclusive, fall, fall market, fall update, february, federal home buyers program, first time buyer, fixed rates, for sale, free house evaluation, government, HBTC, hiring a realtor, home, home buying, home energy, home energy audit, home evaluation, home inspectors, home insurance rebate., home maintenance, home prices, home sales, home selling, home value, house, house prices, house value, housing grants, kaufman, kaufman lofts, kevin baker, kitchener, Kitchener Waterloo, ktichener, kwhometeam, land transfer tax, landlord, landlords, lawyers, lending, license, loft, loft apartments, loft buying, loft prices, loft sales, loft selling, lofts, mansion, mansion lofts, mansion7, march update, market, market anaylsis, market update, market value, may condo sales, mls, MLTT, momentum, momentum developeres, mortage rates, mortgage, mortgage brokers, mortgage news, mortgage rates, mortgage renewal, mortgage rules, mortgages, mulitiple listing service, new construction, newspaper ads, november update, ontario, open house, options for homes, paperwork, park, prices, prime rate, private, rates, rbc, re/max, real estaet, real estate, real estate agent, real estate investment, realtor, realty, reamx, red condo, red condos, remax, remax agent, remax twin city, remax twin city realty, royal bank, rrsp, rules, sale, sales rep, sales representative, sales reps, seagrams, seagrams lofts, segrams, Sellers, selling my condo, selling your home, september, special assessement, spring market, status, status certificate, street, student, summer market, tanglewood condo, tax refund, TD Bank, to do list, twin city, twin city realty, twin city reatly, update, updated, updates, value, variable rates, victoria commons, waterloo, waterloo home sales, waterloo regiion, waterloo region, winter, winter market, yogi bednjicki | Leave a comment
Hope you had a wonderful long holiday weekend. The weather was absolutely perfect and looks like its going to be a hot one for August as well.
Here are the stats from the July market here in Waterloo Region and it continues to stay strong. There were 586 residential properties sold in July, representing an increase of 15.1 per cent compared to the same month last year.
Home sales in July included 322 detached (up 16.4 per cent), and 62 condominium apartments (down 6.1 per cent). Sales also included 148 townhouses (up 45.1 per cent) and 42 semi-detached homes (down 22.2 per cent). On a year-to-date basis we’re seeing sales have increased slightly over last year.
The average sale price of all residential properties sold in July increased by 9.3 per cent to $521,101 compared to July 2018. Detached homes sold for an average price of $613,244 (an increase of 5.4 per cent compared to July of last year. During this same period, the average sale price for an apartment-style condominium was $339,137 for an increase of 15.9 per cent. Townhomes and semis sold for an average of $414,062 (up 17 per cent) and $434,136 (up 11.9 per cent) respectively.
The median price of all residential properties sold last month increased 10.8 per cent to $489,450 and the median price of a detached home during the same period increased by 8.8 per cent to $575,750
There were 844 residential properties listed in K-W and area last month, an increase of 12.8 per cent compared to July of 2018, and an increase of 10.4 per cent in comparison to the previous ten-year average for the month of July The total number of homes available for sale in active status at the end of July totaled 863, a decrease of 8.7 per cent compared to July of last year, and well below the previous ten-year average of 1,467 listings for July. Months Supply of Homes for sale stood at 1.7 months in July, which is 15 percent lower than the same period last year. That is still making it a tight market for buyers and sellers.
There is still strong consumer demand that is making for a busier than normal market for the middle of summer.
The average days it took to sell a home in June was 22 days, which is the same number of days it took in July 2018.
Historical Sales By Property Type
Months Supply of Homes for Sale
Historical Median Sales Price – By Property Type
Historical Average Sales Price – By Property Type
Historical Sales – By Price Range
Average Days on Market
If you have any questions or have been thinking of making a move this summer or into the fall, give me a call or text at 519-497-4646 or shoot me an email to kevinbaker@kwhometeam.ca and lets sit down, grab a coffee and plan out a strategy that is best suited for your families needs.
Have a great August!
Kevin
August 6, 2019 | Categories: Buyers, Kitchener Waterloo, Loft Style, New Construction, Sellers, Uncategorized | Tags: 1 victoria, 100 garment, 100 victoria, 144 park, 42 bridgeport, 85 duke, agent, agents, arrow, arrow lofts, assessment, assessment value, bank of canada, barra condos, bauer, bauer lofts, big banks, blackberry, Buyers, bylaw, cambridge, canada trust, canadian mortgage housing corporation, charlie west, CHMC, cibc, city center, city center lofts, city centre, city centre condo, city centre condos, closing costs, closing paperwork, CMHC, condo, condo buyer, condo buying, condo costs, condo lofts, condo prices, condo sales, condo selling, condo unit, condo units, condo update, condo value, condominiums, condos, condos for sale, contribution, days on market, downsizing, downtown, eatons lofts, exclusive, fall market, fall update, federal home buyers program, first time buyer, fixed rates, for sale, free house evaluation, government, HBTC, hiring a realtor, home, home buying, home energy, home energy audit, home evaluation, home inspectors, home insurance rebate., home maintenance, home prices, home sales, home selling, home value, house, house prices, house value, housing grants, kaufman, kaufman lofts, kevin baker, kitchener, Kitchener Waterloo, ktichener, kwhometeam, land transfer tax, landlord, landlords, lawyers, lending, license, loft, loft apartments, loft buying, loft prices, loft sales, loft selling, lofts, mansion, mansion lofts, mansion7, march update, market, market anaylsis, market update, market value, may condo sales, mls, momentum, momentum developeres, mortage rates, mortgage, mortgage brokers, mortgage news, mortgage renewal, mortgage rules, mortgages, mulitiple listing service, new construction, ontario, open house, options for homes, paperwork, park, prices, prime rate, private, rates, rbc, re/max, real estaet, real estate, real estate agent, real estate investment, realtor, realty, reamx, red condo, red condos, remax, remax agent, remax twin city, remax twin city realty, royal bank, rrsp, sale, sales rep, sales representative, sales reps, seagrams, seagrams lofts, segrams, Sellers, selling my condo, selling your home, special assessement, spring market, status, status certificate, street, student, summer market, tanglewood condo, tax refund, TD Bank, to do list, twin city, twin city realty, twin city reatly, update, updated, updates, value, variable rates, victoria commons, waterloo, waterloo home sales, waterloo regiion, waterloo region, winter market, yogi bednjicki | Leave a comment
Hope you had a wonderful long Canada Day weekend. The weather was absolutely perfect and looks like its going to be a hot one for July.
Here are the stats from the July and the market here in Waterloo Region continues to stay strong. There were 658 residential properties sold through the Multiple Listing System (MLS® System) in June, representing an increase of 8.8 per cent compared to the same month last year.
Home sales in June included 404 detached (up 8.9 per cent), and 50 condominium apartments (down 28.6 per cent). Sales also included 159 townhouses (up 27.2 per cent) and 45 semi-detached homes (up 15.4 per cent).
A total of 3,154 homes have sold in Kitchener-Waterloo and area during the first half of this year, an increase of 1.4 per cent compared to 2018.
The average sale price of all residential properties sold in June increased by 8.9 per cent to $533,619 compared to June 2018. Detached homes sold for an average price of $618,186 an increase of 7.9 per cent compared to June of last year. During this same period, the average sale price for an apartment style condominium was $332,716 for an increase of 4.4 per cent. Town homes and semis sold for an average of $411,126 (up 10.7 per cent) and $430,427 (up 9.9 per cent) respectively.
The median price of all residential properties sold last month increased 9.9 per cent to $494,500, and the median price of a detached home during the same period increased by 11.7 per cent to $581,500
There were 888 residential properties listed in K-W and area last month, an increase of 4.3 per cent compared to June of 2018, and a slight increase of 0.5 per cent in comparison to the previous ten-year average for the month of June. The total number of homes available for sale in active status at the end of June totaled 890, a decrease of 10.8 per cent compared to June of last year, and well below the previous ten-year average of 1,581 listings for June. Months Supply of Homes for sale stood at 1.8 months in June, which is 14.3 percent lower than the same period last year.
We’re still in a solid seller’s market situation heading into the summer months, while more new listings are coming onto the market, strong buying demand is keeping supply tight.
The average days it took to sell a home in June was 20 days, compared to 22 days in June 2018.
Here are some charts to compare different parts of the market over the last 10 years.
Historical Sales By Property Type

Months Supply of Homes for Sale
Historical Median Sales Price – By Property Type
Historical Average Sales Price – By Property Type

Historical Sales – By Price Range

Historical Average Days on Market

If you have any questions or have been thinking of making a move this summer or in the fall, give me a call or text at 519-497-4646 or shoot me an email to kevinbaker@kwhometeam.ca and lets sit down, grab a coffee and plan out a strategy that is best suited for your families needs.
Have a great July!
Kevin
July 4, 2019 | Categories: Buyers, Kitchener Waterloo, Loft Style, New Construction, Sellers, Uncategorized | Tags: 1 victoria, 100 garment, 100 victoria, 144 park, 85 duke, agent, agents, arrow, assessment, bank of canada, banks, bauer, blackberry, Buyers, cambridge, canada trust, carbon monoxide, cibc, city center, city centre, closing costs, CMHC, condo, condo buying, condo prices, condo sales, condo selling, condo units, condominiums, condos, condos for sale, days on market, downsizing, downtown, exclusive, first time buyer, fixed rates, for sale, government, home, home buying, home evaluation, home inspectors, home maintenance, home prices, home sales, home selling, home value, house, house prices, house value, kaufman, kevin baker, kitchener, Kitchener Waterloo, kwhometeam, land transfer tax, landlord, landlords, lawyers, lending, license, loft, lofts, mansion, market, market update, market value, mls, momentum, mortage rates, mortgage, mortgage brokers, mortgage news, mortgage rates, mortgages, newspaper ads, ontario, open house, paperwork, park, prices, prime rate, private, rates, real estate, real estate agent, real estate investment, realtor, realty, reamx, remax, royal bank, rrsp, rules, sale, sales rep, sales representative, sales reps, Sellers, selling your home, status, street, student, TD Bank, to do list, twin city, update, updated, updates, value, waterloo | Leave a comment
Hope you had a chance to enjoy the great weather we had on the weekend. It seemed like a very long winter but summer is just around the corner.
Home sales were up in April and we hit an all time high for the Kitchener Waterloo Real Estate Market average home prices which is very big news!!!
There were 623 residential sales in April, an increase of 1.1 per cent versus the same month last year, and up 2.2 per cent compared to the previous ten-year average for April.
Total residential sales in April included 394 detached (up 15.2 per cent), and 75 condominium apartments (up 1.4 per cent). Sales also included 113 townhouses (down 28.9 per cent) and 41 semi-detached homes (no change).
While sales of detached homes did jump a fair bit compared to the same month last year, they were actually on par with the previous 10-year average for April, which means we are getting back to some better market conditions for both buyers and sellers.
The average sale price of all residential properties sold in April increased by 10.9 per cent to $529,800 compared to April 2018. Detached homes sold for an average price of $611,803 an increase of 7.6 per cent compared to April of last year. During this same period, the average sale price for an apartment style condominium was $339,426 for an increase of 14.3 per cent. Townhomes and semis sold for an average of $405,013 (up 5.3 per cent) and $433,949 (up 7.7 per cent) respectively.
Average sale prices hit an all-time high in April. These are the highest sale prices we’ve ever posted in a single month. It’s only the third time the overall residential sale price has exceeded half a million, and for the first time, the average price of a detached home climbed over the 600-thousand-dollar mark.
Likewise, median prices reached an all-time high in April. The median price of all residential properties sold last month increased 11.4 per cent to $490,000, and the median price of a detached home during the same period increased by 11.1 per cent to $568,500
There were 913 residential properties listed in K-W and area last month, a decrease of 6.9 per cent compared to April of 2018, and a decrease of 1.6% in comparison to the previous ten-year average for the month of April. The total number of homes available for sale in active status at the end of April totaled 884, a decrease of 6.1 per cent compared to April of last year, but still well below the previous ten-year average of 1,485 listings for April. Months Supply of Homes for sale stood at 1.8 month in April a decrease of 5.3 per cent compared to last year.
It’s still very much a seller’s market for anyone who is looking for a home under six hundred thousand. In these challenging market conditions, i believe consumers should always seek the expert advice of a local REALTOR®.
If you have any questions or have been thinking of making a move this spring, give me a call or text at 519-497-4646 or shoot me an email to kevinbaker@kwhometeam.ca and lets sit down, grab a coffee and plan out a strategy that is best suited for your families needs.
Have a wonderful Mothers Day to all the mom’s out there.
Kevin
May 7, 2019 | Categories: Buyers, Kitchener Waterloo, Loft Style, New Construction, Sellers, Uncategorized | Tags: agent, agents, april, arrow, assessment, banks, bauer, Buyers, cambridge, city center, city centre, closing costs, CMHC, condo, condo prices, condominiums, condos, condos for sale, contribution, days on market, downsizing, downtown, fall, first time buyer, for sale, home, home buying, home energy audit, home maintenance, home prices, home sales, home selling, home value, house, house prices, housing grants, kaufman, kevin baker, kitchener, Kitchener Waterloo, land transfer tax, landlord, landlords, license, loft, lofts, mansion, market, market update, market value, mls, momentum, mortage rates, mortgage, mortgage brokers, mortgage news, mortgage rates, mortgages, ontario, open house, park, prices, prime rate, rates, real estate, real estate agent, real estate investment, realtor, realty, remax, rrsp, rules, sale, sales representative, sales reps, Sellers, selling your home, status, tax refund, TD Bank, to do list, twin city, update, updated, updates, value, waterloo, winter | Leave a comment
Hope you have been enjoying the frigid weather that we have had in the past month and trying to stay warm. I just wish it could be over already and can’t wait for spring to be honest. So the stats are out for the past month here in Kitchener Waterloo real estate and the home sales were frigid as well.
There were 343 residential sales in February, a decrease of 8.3 percent compared to February 2018. The series of winter storms in February not only kept buyers indoors and off the roads, but also away from open houses and viewings i am sure. This was the lowest amount of sales we’ve seen in February in a very long time.
Total residential sales in February included 178 detached (down 14.8 percent), and 105 condominium units (down 11 per cent). Sales also included 23 semi-detached homes (down 8 percent), 36 free hold townhouses (down 112 percent).
The average sale price of all residential properties sold in February increased 3 percent to $490,668 compared to February 2018 . Detached homes sold for an average price of $597,965 an increase of 3.9 percent compared to February of last year. During this same period, the average sale price for an apartment style condo was $319,536 for an increase of 20.5 percent. Townhomes and semis sold for an average of $395,331 (up 2.6 percent) and $448,123(up 14.4 percent) respectively.
The median price of all residential properties sold last month increased 6.9 percent to $465,000 and the median price of a detached home during the same period increased 2 per cent to $533,500. Despite the chill in the number of sales last month, the price gains reflect that demand continues to outpace supply which is great for sellers but still makes things difficult for many buyers.
There were 562 residential properties listed in K‐W and area last month, a small increase of 1.1 percent compared to February of 2018. The number of active residential listings on the MLS System to the end of February totaled 785, which is 9 percent more than February of last year, but still well below the previous ten year average of 1,296 listing for February.
The average days it took to sell a home in February was 25 days, which is 4 days longer than the amount of time it took in February 2018.
The market remains very much as it has been for the past several months, but the delayed winter weather finally caught up with it. While the market is coming in like a lamb in March we are expecting it to go out like a lion.
If you have any questions or have been thinking of making a move this spring, give me a call or text at 519-497-4646 or shoot me an email to kevinbaker@kwhometeam.ca and lets sit down, grab a coffee and plan out a strategy that is best suited for your families needs.
Stay warm and enjoy your weekend!
March 7, 2019 | Categories: Buyers, Kitchener Waterloo, Loft Style, New Construction, Sellers, Uncategorized | Tags: 1 victoria, 100 victoria, 144 park, 85 duke, agent, agents, arrow, arrow lofts, assessment, banks, bauer, blackberry, Buyers, cambridge, charlie west, cibc, city center, city centre, closing costs, CMHC, condo, condo prices, condo sales, condominiums, condos, condos for sale, days on market, downtown, exclusive, fall, february, first time buyer, for sale, government, home, home buying, home inspectors, home prices, home sales, home selling, home value, house, house prices, housing grants, kaufman, kevin baker, kitchener, Kitchener Waterloo, land transfer tax, landlord, landlords, lawyers, loft, lofts, mansion, mansion lofts, market, market update, market value, mls, momentum, mortage rates, mortgage, mortgage brokers, mortgage rates, mortgages, ontario, open house, park, prices, private, rates, real estate, real estate agent, real estate investment, realtor, realty, red condos, remax, rrsp, sale, sales representative, seagrams, segrams, Sellers, selling your home, status, TD Bank, to do list, twin city, twin city realty, update, updated, updates, value, waterloo, winter | Leave a comment
Fall is here, and that brings with it leaves falling and the beautiful colors of the season. I hope you had a great Halloween with the kids and today i thought i would let you know how the Real Estate did market here in Waterloo region.
There were 514 homes sold through the Multiple Listing System (MLS® System) in October, an increase of 7.8 per cent compared to October of last year. On a year-to-date basis 5,070 residential units have sold compared to 5,822 during the same period in 2017, a decrease of 12.9 per cent. It was a stronger than average October for home sales and listing activity for sure. Gradually increasing interest rates could be nudging both buyers and sellers from the sidelines of the housing market in my opinion.
Residential sales in October included 297 detached (up 4.6 per cent compared to October 2017), and 128 condominium units (up 19.6 per cent) which includes any property regardless of style (i.e. semis, townhomes, apartment, detached etc.). Sales also included 36 semi-detached homes (down 18.2 per cent) and 47 freehold townhouses (up 23.7 per cent).
The average sale price of all residential properties sold in October increased 7.7 per cent to $489,725 compared to the same month a year ago. Detached homes sold for an average price of $576,731 an increase of 6.2 per cent compared to October of last year. During this same period, the average sale price for an apartment style condominium was $310,215 an increase of 24.1 per cent. Townhomes and semis sold for an average of $387,602 (up 10.9 per cent) and $403,750 (up 13.8 per cent) respectively.
The median price of all residential properties sold last month was up 6.5 per cent compared to October of last year at $444,500 and the median price of a detached home during the same period increased 8.5 per cent to $525,350. Not surprisingly we’re seeing the biggest surges in average price happening in the denser forms of housing such as condos. This is partly a reflection of demand being strongest in the entry-level price ranges as well as there being more newly constructed units in the mix.
New listings totaled 760 residential properties in K-W and area in last month, a 14 per cent increase compared to October of last year, and 12.7 per cent above the historical ten-year average of 674. The number of active residential listings at the end of October totaled 1,014, which is 21 per cent higher than October of last year but still 461 units fewer than the previous ten-year average of 1,475 listings for October.
If you have any questions or are thinking of buying or selling a property in the coming months, please give me a call at 519-497-4646 or email to kevinbaker@kwhometeam.ca and we can sit down, grab a coffee and discuss the best way to make it a smooth move for your family.
Enjoy your week!
Kevin
November 6, 2018 | Categories: Buyers, Kitchener Waterloo, Loft Style, New Construction, Sellers, Uncategorized | Tags: 1 victoria, 100 victoria, 85 duke, agents, arrow, assessment, banks, bauer, bauer lofts, blackberry, Buyers, cambridge, charlie west, city center, city centre, closing costs, CMHC, condo, condominiums, condos, downsizing, downtown, exclusive, fall, first time buyer, for sale, home, home buying, home inspectors, home maintenance, home prices, home sales, home selling, home value, house, house prices, kaufman, kitchener, landlord, landlords, lawyers, license, loft, lofts, mansion, market, market update, market value, mls, momentum, mortgage, mortgage brokers, mortgage news, mortgage rates, mortgages, november update, ontario, open house, prices, rates, rbc, real estate, real estate agent, real estate investment, realtor, realty, red condo, remax, remax twin city, rrsp, rules, sale, Sellers, selling your home, status, twin city, twin city realty, update, updates, value, waterloo, waterloo region, winter | Leave a comment
The trend continues here in the Kitchener Waterloo housing market as well as many other urban centers in Ontario. It was another record breaking month for homes sales in the region mostly due to the lack of inventory.
Home sales through the Multiple Listing System (MLS® System) totaled 535 last month, an increase of 27.1 percent compared to November of 2015, marking another record breaking month for residential properties sold. November’s sales included 352 single detached homes (up 34.4 percent compared to November 2015) and 118 condominium type units (down 22.9%) which include any property regardless of style (i.e. semis, townhomes, apartment, detached etc.). Sales also included 32 semi-detached homes (up 45.5 percent) and 28 freehold townhouses (down 20 percent).
Record breaking sales are also being tallied on a year-to-date basis with 6,352 residential transactions compared to 5,341 during the same period in 2015, representing an increase of 18.9 percent. “Year-to-Date Sales to the end of November have now exceeded any previous end-of-year totals on record.
In 2007, sales to the end of the year exceeded 6,000 units for the first time, and haven’t hit that high-water mark again, until now, an entire month earlier. Inventory levels on the other hand, remain stubbornly low. In their October release, the Canadian Real Estate Association stated that, “the tight balance between housing supply and demand in Ontario’s Greater Golden Horseshoe region is without precedent (including the GTA, Hamilton-Burlington, Oakville-Milton, Guelph, Kitchener-Waterloo, Cambridge, Brantford, the Niagara Region, Barrie and nearby cottage country).” As of the end of November, the KWAR’ MLS® System only had 565 active residential listings on the market, down 23.1 percent compared to the previous month, and 60.8 percent below the same period last year.
The average price of all residential properties sold in November was $411,602 a 15.5 percent increase over 2015. Detached homes sold for an average price of $473,104, an increase of 13.9 percent compared to November 2015. During this same period, the average sale price for an apartment style condominium was $209,360, a decrease of 8 percent. Townhomes and semis sold for an average of $310,151 (up 14.8 percent) and $330,534 (up 27.7 percent) respectively.
With a notable shortage of inventory, many properties are selling above list price and this is because you have many buyers competing for fewer properties, and this is pushing up the average price. The median price of all residential properties sold in November increased 18 percent to $377,500, and the median price of a detached home during the same period increased 16.4 percent to $425,000.
In my opinion those are some staggering numbers and there is no sign of it slowing down in the near future.
If you have any questions on the information or are thinking of buying or selling your home now or in the spring please give me a call and we can sit down and discuss the best options and strategies for you and your family.
Have a wonderful December and Holiday Season!
Kevin
December 2, 2016 | Categories: Buyers, Kitchener Waterloo, Loft Style, New Construction, Sellers, Uncategorized | Tags: assessment value, CMHC, condo, condo buying, condo costs, condo selling, condo units, condo value, downsizing, first time buyer, kevin baker, kitchener, ktichener, loft apartments, loft buying, loft selling, market, market update, mortgage, mortgage brokers, mortgage news, new construction, real estate, remax, sales reps, twin city realty, update, waterloo, waterloo region | Leave a comment
On October 17th, the federal government set up new guidelines for qualifying for a mortgage here in Canada. The federal government says it’s responding to concerns that sharp increases in housing prices in Toronto, Vancouver and elsewhere could increase defaults in the future, should historically low interest rates finally start to climb.
One of the key changes is that homeowners will be subject to a mortgage rate stress test beginning Oct. 17. It does not matter what size of down payment they have. Before now, those with less than a 20 per cent down payment were required to pass a stress test and have mortgage insurance backed by the federal government through the Canada Mortgage and Housing Corporation.
The test measures whether the buyer could still afford to make payments if mortgage rates rose to the Bank of Canada’s posted five-year fixed mortgage rate.
That rate is usually significantly higher than what a buyer can negotiate with banks or other lenders. For instance, TD has a five-year fixed rate mortgage at 2.59 per cent, while the Bank of Canada’s rate is 4.64 per cent.
The stress test also sets a ceiling of no more than 39 per cent of household income being necessary to cover home-carrying costs such as mortgage payments, heat and taxes.
It has been said that Regulators are under intense pressure to do something because home prices are climbing fast and may be over-valued in some markets. They want to avoid any kind of catastrophe on their watch..
So is this a good thing for Canadian housing? Many markets outside of the larger centers are also experiencing a sharp increase in house prices. Here in Kitchener Waterloo, the demand for medium priced homes is literally a bidding war with many homes selling for far more than i think they should be. That being said, prices are a reflection of supply and demand so that current pricing is a direct result of many more buyers than sellers.
The new rules also mean that, beginning this tax year, all home sales must be reported to the Canada Revenue Agency. The gains from sales of primary residences will remain tax-free, but the government is aiming to block foreign buyers from purchasing and flipping homes while falsely claiming the primary residence exemption from capital gains tax.
It remains to be seen whether these steps will tighten the current market, expand or collapse it. My only advice is that if you are thinking of selling your home this fall that you take advantage of the extremely low inventory levels that we have in Waterloo region.
Give me a call and we can grab a coffee and discuss the best solution for you and your family. You can reach me at 519-497-4646 or email to baker_kevin@rogers.com
Have a great day
Kevin
October 26, 2016 | Categories: Buyers | Tags: Buyers, cambridge, CMHC, home buying, home selling, house prices, mortgage, mortgage rules, remax, rules, Sellers, twin city, waterloo region | Leave a comment
The trend continues here in Kitchener Waterloo with no signs of cooling. The demand for homes is Hot Hot Hot.
A total of 540 residential properties changed hands in Kitchener Waterloo and area though the MLS® System. This represents a 29.2 percent increase in sales compared to September of 2015, and is a new record high for the month.
On a year-to-date basis 5,241 residential units have sold compared to 4,456 during the same period in 2015, an increase of 17.6 percent. This is the first time sales have exceed the 5000 unit mark at the end of the third quarter. The demand is strong but the supply of homes still continues to lag well behind. Residential listing inventory totaled 815, a decline of 51 percent compared to September 2015.
Showing the most traction, were the sales of condominium type units, which include any property regardless of style (i.e. semis, town homes, apartment, detached etc.), increasing 80.6 percent to 130 transactions in September relative to the same month a year ago.
Meanwhile, 333 single detached homes sold last month, an increase of 19.8 percent, compared to last year. September’s sales also included 31 Semi-detached homes (down 18.4 percent) and 33 freehold townhouses (up 22.2 percent).
The average price of all residential properties sold year-to-date was $380,692, a 9.7 percent increase over 2015. The average price of a detached home to the end of the third quarter was $443,554, an 11.8 percent increase over 2015. During this same period, the average sale price for an apartment style condominium was $231,187, an increase of 4.5 percent. Townhomes and semis sold for an average of $281,709 (up 8.3 percent) and $293,167 (up 8.5 percent) respectively.
The median price of all residential properties sold year-to-date increased 9.9 percent to $350,000, and the median price of a detached home during the same period increased 10.9 percent to $400,500. Like many other markets in Ontario, it continues to be a sellers’ market here in Waterloo region. Due to the outweighing demand over supply, its putting upward pressure on prices.
With the new changes by the federal government, introducing the mortgage rate “stress test” on all new insured mortgages, could delay home purchases for some first time home buyers, as they assess what they can afford, and possibly save for a bigger down payment.
I don’t believe that these changes will impact our area to a large degree, the very fact that the government is taking steps could cause a slight cooling of the market.
If you have any questions or are thinking of buying or selling this fall please give me a call and we can discuss some strategies that would work best for you.
Have a great Thanksgiving!
Kevin
October 6, 2016 | Categories: Buyers, Kitchener Waterloo, New Construction, Sellers, Uncategorized | Tags: arrow lofts, bauer lofts, CMHC, condo, condo buying, condo selling, fall market, kaufman, kitchener, loft buying, loft selling, lofts, market update, mortgage, mortgage rates, mortgage rules, rates, seagrams, twin city realty, update, waterloo | Leave a comment
Hi there and hope you had a fantastic summer!
The housing market here in Kitchener Waterloo is as hot as the weather has been this past summer! There were a total of 598 home sales in KitchenerWaterloo and area though the Multiple Listing System (MLS® System) of the Kitchener-Waterloo Association of REALTORS® (KWAR) in August. This represents a 26.4% increase in sales compared to August of 2015. It also ranks as the most active August on record and 37.6% above the 5-year average for the month. That is simply amazing.
Year-to-date sales also climbed to new heights with 4,703 residential sales so far in 2016. Again, this is the highest on record for this period and 23.4% above the 5-year average.
We are still experiencing a lower than normal listing number with active listings almost half of what they were last year at this time. Active listings through the MLS® System to the end of August sat at 863, which is 46.6% lower compared to same period last year’s 1,616 homes that were on the market. That means we are still experiencing a very tight market in terms of availability of homes which continues to push up home prices in the region.
August’s sales included 353 single detached homes (up 19.7% compared to August 2015) and 151 condominium type units (up 36.0%) which include any property regardless of style (ie. semis, townhomes, apartment, detached etc). Sales also included 40 Semi-detached homes (up 14.3%) and 49 freehold townhouses (up 69.0%).
The average sale price of all residential sales in August increased 15.2% to $402,000 compared to August 2015. Its clear that as a result of the strong residential activity that buyers remain confident about home values here in the region.
Single detached style homes sold for an average price of $487,050 an increase of 20.9% compared to last year. The average sale price for an apartment style condominium was $233,302, an increase of 7.9%. Townhomes and semis sold for an average of $298,148 (up 10.2%) and $299,353 (up 5.5%) respectively.
Overall. the market is extremely competitive and if you are thinking of selling your home now is a great time to take advantage of the strong home prices. If you have any questions or would like to get together for a coffee and discuss how we can help with your housing needs please give me a call or text at 519-497-4646. You can also email me at kevinbaker@kwhometeam.ca
September 8, 2016 | Categories: Buyers, Loft Style, New Construction, Sellers, Uncategorized | Tags: agent, agents, assessment value, banks, closing costs, CMHC, condo, condo buying, condo costs, condo selling, condo units, condo value, downsizing, fall market, first time buyer, home inspectors, kevin baker, kitchener, ktichener, kwhometeam, loft, loft apartments, loft buying, loft selling, lofts, market, market update, market value, mls, mortgage, mortgage brokers, mortgage news, mortgage rates, new construction, ontario, open house, real estate, realtor, remax, sales rep, sales representative, sales reps, selling my condo, twin city realty, update, waterloo, waterloo region | Leave a comment
All I have to say is WOW!!!! What an incredible month for the Kitchener Waterloo and Cambridge Real Estate Markets. The market is on fire with many homes selling over list price in multiple offer situations. The buyers seemed to be lined up out the door if you have a property under the 430k mark in certain neighborhoods of town.
Here are some of the stats from the past month. There were 752 properties sold in KW and area which represents a 19.6% increase compared to May of 2015, and a 27.7% increase compared to the 5-year average for the month of May.
This is the first time since 2007 that residential sales in May exceeded seven hundred units. Year-to-date sales for 2016 also hit an all-time high with 2,776 homes sold in the first five months of the year, 19.2% above last year’s total for the same period and 21.0% above the 5-year average.
Active listings however are down in comparison from last year. Currently, the number of active residential listings on the KWAR’s MLS® System to the end of May is at 1,283 which are 26.1% lower compared to same period last year. This translates to 35.2% fewer available listings on the market today than the same time last year.
So what does that mean? If you are thinking of selling your home now is a great time to do it. Unfortunately you may also wish to buy and that could prove challenging with the lower than usual inventory buyers often find themselves competing with other buyers, for the same property.
With steady interest rates expected into the later part of 2016 and early 2017, and steady employment growth, the region is poised to continue the demand for housing and we should see balanced market conditions return for the foreseeable future in Waterloo Region.
May’s sales included 474 single detached homes (up 15.6%) and 166 condominium type units (up 37.2%) which include any property regardless of style (ie. semis, townhomes, apartment, detached etc). Sales also included 47 Semi-detached homes (down 11.3%) and 56 freehold townhouses (up 27.3%). The average sale price of all residential sales increased 7.3% to $378,248 compared to May 2015. Single detached style homes sold for an average price of $438,708 an increase of 9.8% compared to last year. The average sale price for an apartment style condominium was $221,073, a decrease of 1.2%. Townhomes and semis sold for an average of $277,355 (up 1.1%) and $296,751 (up 10.2%) respectively.
If you have any questions on the stats or are thinking of making a move in the near future, please give me a call and we can sit down, grab a coffee and look at your options.
Have a great week!
Kevin
June 6, 2016 | Categories: Buyers, Kitchener Waterloo, Loft Style, New Construction, Sellers, Uncategorized | Tags: assessment, assessment value, banks, CMHC, condo, condo costs, condo selling, condo units, condo value, first time buyer, kevin baker, kitchener, ktichener, loft, loft apartments, loft buying, loft selling, market, market update, mortgage, mortgage brokers, mortgage news, new construction, real estate, realtor, remax, sales reps, twin city realty, update, waterloo, waterloo region | Leave a comment
It was another Fantastic Month for Home Sales here in Waterloo Region with 584 properties sold in the Kitchener Waterloo area.
This represents a 16.3% increase compared to the March of 2015, and ranks as the highest March on record since 2010. That is just incredible.
During the first quarter of 2016, there were 1,350 home sales, 23.9% above last year’s total for the same period and 17.8% above the 5-year quarterly average and the highest quarter on record since 2010. On a monthly basis, home sales were 16.6% above the 5-year average for the month of March. The mild weather has brought the buyers out in droves and the spring market is well underway!
March’s sales included 383 single detached homes (up 11.2 %) and 110 condominium type units (up 26.4%) which include any property regardless of style (ie. semis, townhomes, apartment, detached etc). Sales also included 38 Semi-detached homes (down 2.6%) and 42 freehold townhouses (up 50.0%).
The average sale price of all residential sales increased 5.8% to $371,733 compared to March 2015. Single detached style homes sold for an average price of $428,495 an increase of 9.2% compared to last year. The average sale price for an apartment style condominium was $211,117, a decrease of 11.9%. Townhomes and semis sold for an average of $284,226 (up 9.7%) and $276,562 (up 0.6%) respectively.
Sales activity in the $350,000 – $399,999 range increased significantly in the month of March with 98 homes sold in that range, a 78.2% increase from the same time last year. Yes I said 78.2%!! That is clearly evident with all the multiple offers that we have been involved in over the past month.
Year-to-date residential sales in the $300,000-$399,999 remain most popular with 490 sales to date accounting for 36.3% of all residential sales. Pushing the average sales price up for the month were increased sales in the $500,000 – $749,999 range, which posted a 31.6% increase in units sold, compared to March 2015
All in all, Kitchener Waterloo is still showing that we have a vibrant economy and home values are continuing to show strength.
If you have any questions on the information above or are interested in buying or selling in the coming months feel free to give me a call at 519-497-4646 or email to kevinbaker@kwhometeam.ca
I am happy to help.
Have a wonderful April!
Kevin
April 6, 2016 | Categories: Buyers, Kitchener Waterloo, Loft Style, New Construction, Sellers, Uncategorized | Tags: CMHC, condo buying, condo selling, condo units, condo value, downsizing, first time buyer, kevin baker, kitchener, ktichener, loft, loft apartments, loft buying, loft selling, market, market update, market value, mortgage, mortgage brokers, new construction, real estate, realtor, remax, sales reps, twin city realty, update, waterloo, waterloo region | Leave a comment
Happy New Year! I hope you are enjoying the winter weather that has finally arrived.
It was another strong finish for the Residential Real Estate market here in Waterloo Region in 2015.
A total of 5,563 sales were processed through the Multiple Listing Service (MLS®) which was an increase of 4.9% percent compared to sales in 2014 . Unlike 2014, which remained slow almost half the year, 2015 only lagged behind in home sales for the first two months of the year. With relatively normal winter weather and no ice storm or polar vortexes, the spring market did not experience the same delay seen in 2014.
Residential sales finished this year with 293 home sales in December compared 262 the same time last year in Kitchener-Waterloo and area. This equates to an 11.8% increase in the number of sales for the month. This month there were 168 detached homes (down 4.5%), 80 condominiums (up 53.8%), 20 townhomes (up 33.3%) and 23 semi-detached (up 21.0%) sold, with the average price of all homes sold this month coming in at $367,121 (up 8.2%).
Overall It’s been a fantastic year for home sales in the Region, which speaks volumes about the economy, the opportunities and innovation taking place in Waterloo Region.
Total residential sales in 2015 included 3,576 single detached homes (up 4.9% from 2014), 409 semi-detached (up 4.6%), 398 townhomes (up 2.3%) and 1,180 condominium units (up 5.9%). The average sale price of all residential sales in 2015 increased 3.9 percent to $348,888 in comparison to 2014. Single detached homes sold for an average price of $400,456 (up 3.5%), semi-detached for $268,400 (up 3.4%), townhomes for $301,005 (up to 4.1%) and condominiums sold for an average of $237,735 (up 7.3%).
Locally, Waterloo Region remains a strong and stable housing market. The excitement around the area from the ION, the burgeoning tech sector, the rural and urban blend position Waterloo Region as a highly desirable place to live and invest.
If you have any questions regarding the local Real Estate market, thinking of buying or selling this spring or know of someone that is, please let me know. I am always happy to help and provide advice where ever I can.
Have a great week!
Kevin
January 18, 2016 | Categories: Buyers, Kitchener Waterloo, Loft Style, New Construction, Sellers, Uncategorized | Tags: CMHC, condo, condo buying, condo selling, condo units, condo value, downsizing, first time buyer, home inspectors, kevin baker, kitchener, ktichener, kwhometeam, loft, loft apartments, loft buying, loft selling, market, market update, market value, mortgage, mortgage brokers, mortgage rates, new construction, real estate, realtor, remax, sales reps, twin city realty, update, waterloo, waterloo region | Leave a comment
Its been another strong month of home sales here in the Waterloo Region. With a total of 459 sold through the Multiple Listing System (MLS®). The month of August did post a 2.1% decrease in home sales compared to the same month last year across Kitchener-Waterloo and area. However, home sales in the month of August were 9.5% percent above the 5-year average for the month.
This strong sales activity helped bring year-to-date total sales to 3,991, a 6.1% increase compared to the same time last year, and 6% above the 5-year average. Year-to-date sales were also the highest on record since 2008. There was strong residential sale activity this summer season and with recording setting year-to-date sales it’s clear that buyers remain confident about the value of homes in Kitchener-Waterloo and area.
Residential sales in August included 284 single detached homes (down 2.1% from last year), 35 semidetached (up 2.9%), 29 townhomes (down 17.1%) and 107 condominium units (down 0.9%). The average sale price of all residential sales through the KWAR’s MLS® System increased 6.6% percent last month to $347,057 compared to August 2014. Single detached homes sold for an average price of $401,533 an increase of 6.2% percent compared to last year. The average sale price for a condominium was $241,508, an increase of 7.7% percent and the average sale price for a freehold townhome was $300,546, an increase of 2.9% percent from the same time last year.
Overall these numbers show that the real estate sector here in the Kitchener Waterloo is showing no signs of slowing down and points to a long term stability and strength.
If you have any questions on any of the information provided above or would like to discuss your specific real estate needs please give us a call or email to kevinbaker@kwhometeam.ca
Have a great day!
September 9, 2015 | Categories: Buyers, Kitchener Waterloo, Loft Style, New Construction, Sellers, Uncategorized | Tags: CMHC, condo buying, condo selling, condo units, condo value, first time buyer, kevin baker, kitchener, ktichener, loft, loft apartments, loft buying, loft selling, market, market update, mortgage, mortgage brokers, mortgage news, new construction, real estate, realtor, remax, sales reps, twin city realty, update, waterloo, waterloo region | Leave a comment