
August Home Sales Ease as prices Continue to rise here in Waterloo Region
Hope you had a wonderful weekend. Back to school is here and I am sure all the kids have settled in and got the new school year underway. August was another great month for Waterloo region real estate and here are the stats to keep you right up to date.
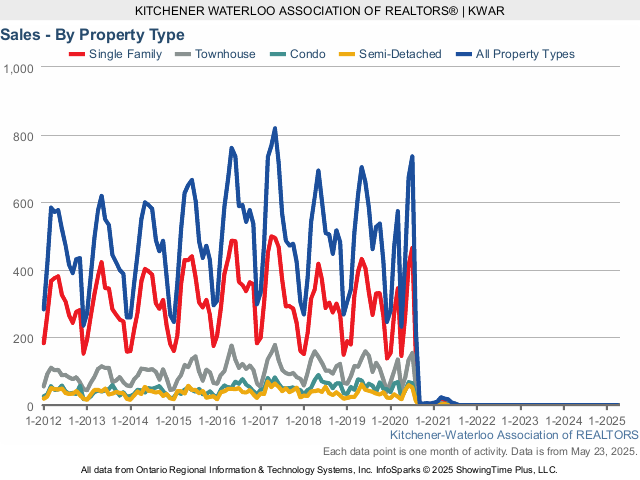
There were 459 residential properties sold through the MLS® in August, a decrease of 9.1 per cent compared to the same month last year.
Home sales in August included 267 detached (down 11.9 per cent), and 56 condominium apartments (down 13.8 per cent). Sales also included 97 townhouses (down 4.9 per cent) and 39 semi-detached homes (up 11.4 per cent).
The number of homes sold last month was below the average for August; however, we continue to see strong price gains across all property types.
The average sale price of all residential properties sold in August increased by 6.4 per cent to $524,482 compared to August 2018. Detached homes sold for an average price of $615,568 (an increase of 5.4 per cent compared to August of last year. During this same period, the average sale price for an apartment-style condominium was $324,778 for a decrease of 3.1 per cent. Townhomes and semis sold for an average of $420,239 (up 18.3 per cent) and $441,802 (up 10.2 per cent) respectively.
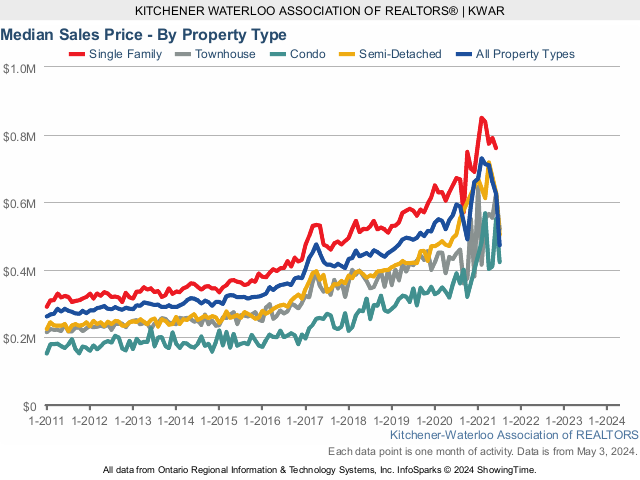
The median price of all residential properties sold last month increased 8.1 per cent to $495,000 and the median price of a detached home during the same period increased by 2.8 per cent to $560,000.
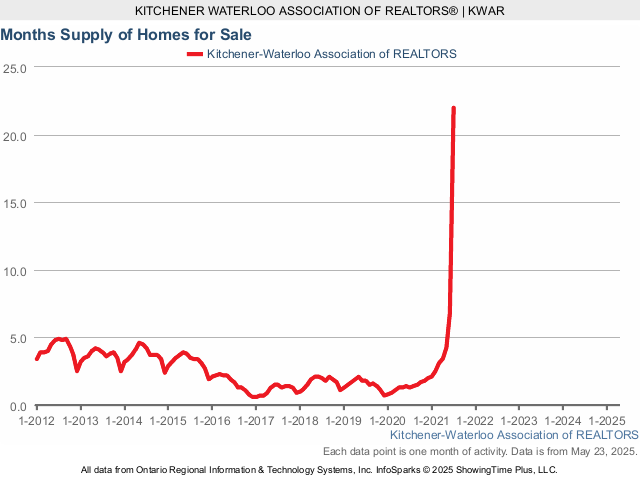
There were 574 residential properties in K-W and area last month, a decrease of 14.5 per cent compared to August of 2018, and a decrease of 13 per cent in comparison to the previous ten-year average for the month of August. The total number of homes available for sale in active status at the end of August totalled 734, a decrease of 17.3 per cent compared to August of last year, and well below the previous ten-year average of 1,426 listings for August. Months Supply of Homes for sale stood at 1.5 months in August, which is 16.7 percent lower than the same period last year.
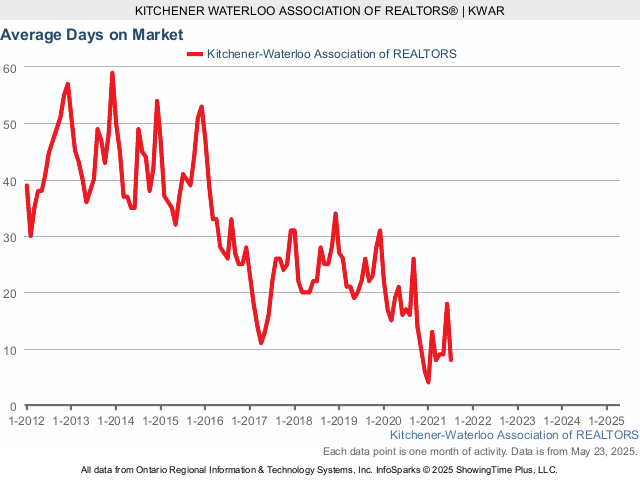
The average days it took to sell a home in August was 26 days, which is two days fewer than it took in August 2018.
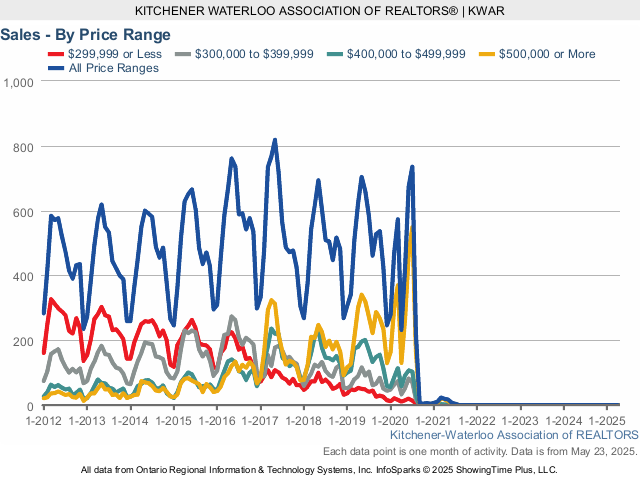
We’re noting differences in market balance depending on the price range, for homes priced under $600 thousand, it is still a strong seller’s market, whereas above $600 thousand, it is a more balanced situation.
One this to look at is the month’s supply of homes, also known as the absorption rate. For homes priced at more than $600,000, the months of supply stood at 3.4 in August, compared to 0.9 months for homes prices under that amount. Months supply is the inventory of homes for sale at the end of a given month, divided by the average monthly closed sales from the last 12 months. The previous ten-year average months supply across all price ranges has been just over 3 months.
It all comes down to what the buyers can find in their price range, homes in Kitchener-Waterloo are definitely in high demand, and there is strong competition among buyers trying to find one that will suit them.
Historical Sales by Property Type
Months Supply of Homes for Sale
Historical Median Sales Price – By Property Type
Historical Average Sales Price – By Property Type
Historical Sales – By Price Range
If you have any questions or have been thinking of making a move this summer or into the fall, give me a call or text at 519-497-4646 or shoot me an email to kevinbaker@kwhometeam.ca and lets sit down, grab a coffee and plan out a strategy that is best suited for your families needs.
Have a great September!
Kevin

Leave a comment