
Rising Inventory and Declining Sales the Trend for Waterloo Regions Housing Market in 2025
I hope you are having a wonderful holiday season with your families. I myself ate a little too much but really enjoyed getting together with family and friends over Christmas and New Years.
Now that 2026 has started, the kids are back to school, I notice the gym is a little busier each day that I am there but that’s great, hopefully everyone can keep their new years resolutions!
The stats are out for last year for the real estate market so lets take a look…
There were 6,177 homes sold in Waterloo Region in 2025, a decrease of 8.8 per cent compared to 2024, and a 25.3 per cent compared to the previous ten-year average for annual sales.
On a monthly basis, 306 homes were sold in December, a decrease of 9.5 per cent compared to the same period last year and a decrease of nearly 19.5 per cent compared to the average number of homes sold in the previous ten years for the same month.
In Waterloo Region, we observed an increase in new listings coming onto the market in 2025, accompanied by softening sales and longer selling times. This trend occurred during a year when affordability remained a challenge for many aspiring homebuyers, as global and economic uncertainty contributed to a weaker housing market. With the downward pressure on housing prices, and more options for buyers, it proved to be a good year for those first-time buyers who were able to get into the market.
Total residential sales in December included 192 detached homes (no change from December 2024), and 52 townhouses (down 39.1 per cent). Sales also included 35 condominium units (down 14.6 per cent) and 26 semi-detached homes (up 23.8 per cent).
For 2025, total residential sales included 3,779 detached (down 7.7 per cent), and 1,174 townhouses (down 14.4 per cent). Sales also included 727 condominium units (down 11.6 per cent) and 484 semi-detached homes (up 1.5 per cent).
In December, the average sale price for all residential properties in Waterloo Region was $716,911. This represents a 5.9 per cent decrease compared to December 2024 and a 0.5 per cent increase compared to November 2025.
- The average sale price of a detached home was $839,394. This represents a 6.0 per cent decrease from December 2024 and an increase of 1.4 per cent compared to November 2025.
- The average sale price for a townhouse was $568,249. This represents a 9.8 per cent decrease from December 2024 and a decrease of 4.4 per cent compared to November 2025.
- The average sale price for an apartment-style condominium was $366,784. This represents a 22.9 per cent decrease from December 2024 and a decrease of 13.1 per cent compared to November 2025.
- The average sale price for a semi was $601,535. This represents a decrease of 6.7 per cent compared to December 2024 and a decrease of 5.6 per cent compared to November 2025.

Year-to-date, the average sale price for all residential properties in Waterloo Region decreased 3.7 per cent to $754,199 compared to 2024.
- The year-to-date average price of a detached home was $876,896. This represents a 3.7 per cent decrease compared to 2024.
- The year-to-date average sale price for a townhouse was $611,256. This represents a 4.3 per cent decrease compared to 2024.
- The year-to-date average sale price for an apartment-style condominium was $437,084. This represents a 7.4 per cent decrease compared to 2024.
- The year-to-date average sale price for a semi was $635,412. This represents a decrease of 4.1 per cent compared to 2024.
| Monthly MLS® Home Price Index Benchmark Price (HPI) | ||||||
| Kitchener-Waterloo | Cambridge | |||||
| Benchmark Type: | December 2025 | Monthly % Change | Yr./Yr. % Change | December 2025 | Monthly % Change | Yr./Yr. % Change |
| Composite | $640,100 | -0.4 | -8.8 | $674,300 | -1.6 | -6.1 |
| Single Family | $752,200 | -0.3 | -8.1 | $714,100 | -2.0 | -5.8 |
| Townhouse | $527,600 | -0.6 | -8.8 | $597,100 | -0.4 | -4.5 |
| Apartment | $392,000 | -0.9 | -11.6 | $430,600 | -1.3 | -8.3 |
| Annual MLS® Home Price Index Benchmark Price | ||||
| Kitchener-Waterloo | Cambridge | |||
| Benchmark Type: | 2025 | Yr./Yr. % Change | 2025 | Yr./Yr. % Change |
| Composite | $679,600 | -5.4% | $712,200 | -4.0% |
| Detached | $799,800 | -5.1% | $756,300 | -3.4% |
| Townhouse | $554,400 | -6.3% | $617,500 | -4.0% |
| Apartment | $415,500 | -7.50% | $451,600 | -5.9% |
There were 375 new listings added last month, an increase of 6.5 per cent compared to December last year, and an 11.3 per cent increase compared to the previous ten-year average for December.
In 2025, 13,872 new listings were added, an increase of 5.2 per cent compared to 2024, and a 15.7 per cent increase compared to the previous ten-year annual average.
At the end of December, there were 1,188 homes available for sale in active status, representing a 15.9% increase from the same month last year. This number surpasses the previous ten-year average of 595 homes in December.
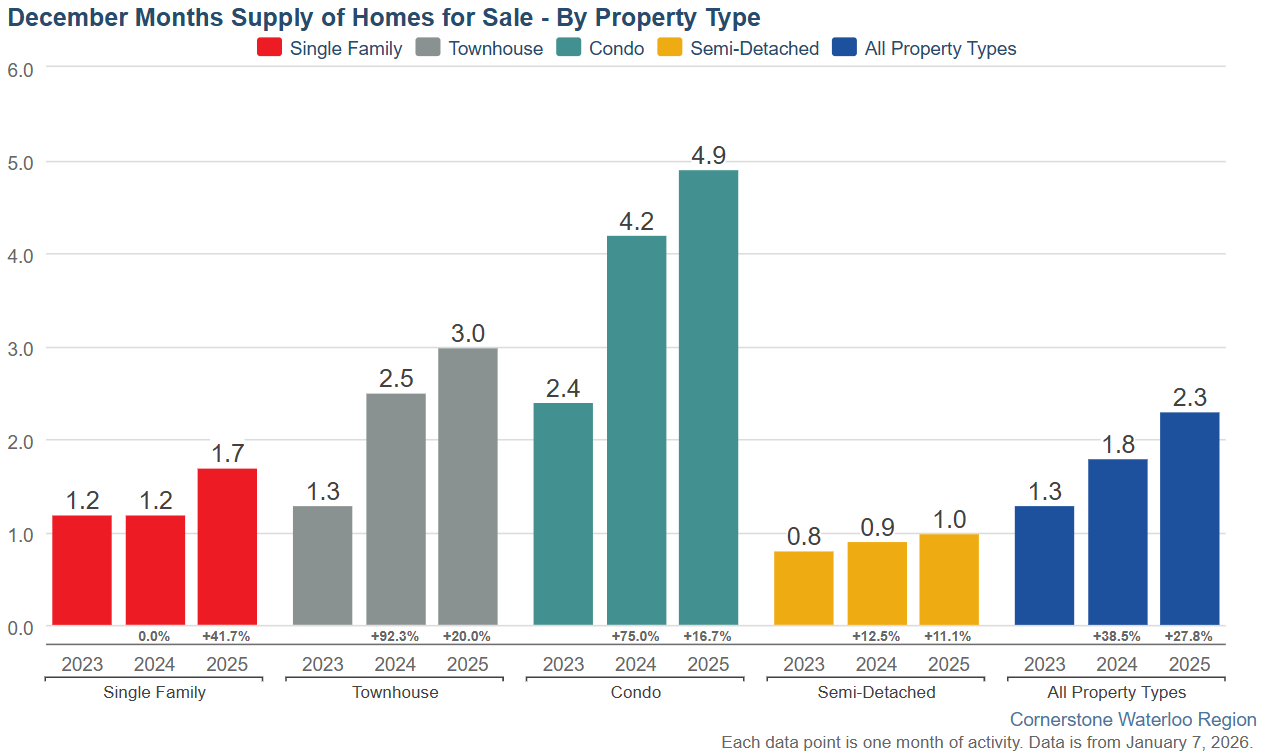
The total inventory across the market increased by 27.8 percent, resulting in a 2.3-month supply of all property types by the end of December. Condominium apartments had the highest inventory, with 4.9 months’ supply, followed by townhouses with 3.0 months’ supply and detached homes with 1.7 months’ supply. The number of months of inventory represents the time it would take to sell all current inventories at the current sales rate.
The average time to sell a home in December was 45 days, which is 6 days longer than the previous month. In December 2024, it took 36 days for a home to sell, and the five-year average was 24 days.
Average Sales Price – Municipality
Average Sales Price – Township
Monthly Sales By Property Type
Monthly Supply of Homes for Sale
Monthly Median Sales Price – By Property Type
Monthly Average Sales Price – By Property Type
Monthly Average Days on Market
Monthly Number of New Listings – By Property Type
Monthly Homes for Sale
Monthly Supply of Homes for Sale – By Property Type
If you have any questions at all, are thinking of making a move this winter into spring, or are wondering what your home might be worth, give me a call or text to 519-497-4646 or shoot me an email to kevinbakerrealestate@gmail.com and we can sit down for a coffee and chat about your family’s needs going forward.
Have a great weekend!
Kevin
Condo Sales Down in October in Waterloo Region
I hope you are having a wonderful weekend. Looks like we have snow in the region today but hopefully it doesn’t stay too long. I am sure we will be hearing Christmas music on the radio soon enough.
The Real estate market stats are out for October and things seem to have taken a bump up in the first 2 weeks of October but that was short lived with the market slowing down again near the end of the month. Let’s take a look at the breakdowns.
There were 569 homes sold last month. This represents a 6.7 per cent decrease compared to the same period last year and a decline of 18.4 per cent compared to the average number of homes sold in the previous ten years for the same month.
While October home sales in Waterloo Region lag behind historical averages, activity did pick up compared to September. With more listings available than we typically see this time of year and borrowing costs beginning to ease, buyers have the opportunity to explore a wider range of options.
Total residential sales in October included 371 detached homes (down 3.4 per cent from October 2024), and 89 townhouses (down 16.8 per cent). Sales also included 56 condominium units (down 16.4 per cent) and 49 semi-detached homes (down 2.0 per cent).
In October, the average sale price for all residential properties in Waterloo Region was $734,928. This represents a 5.6 per cent decrease compared to October 2024 and a 2.4 per cent decrease compared to September 2025.
- The average sale price of a detached home was $842,907. This represents a 4.8 per cent decrease from October 2024 and a decrease of 1.6 per cent compared to September 2025.
- The average sale price for a townhouse was $593,652. This represents an 8.2 per cent decrease from October 2024 and a decrease of 2.2 per cent compared to September 2025.
- The average sale price for an apartment-style condominium was $433,746. This represents a 10.2 per cent decrease from October 2024 and a decrease of 1.9 per cent compared to September 2025.
- The average sale price for a semi was $573,332. This represents a decrease of 11.9 per cent compared to October 2024 and a decrease of 7.7 per cent compared to September 2025.

| MLS® Home Price Index Benchmark Price (HPI) | ||||||
| Kitchener-Waterloo | Cambridge | |||||
| Benchmark Type: | October 2025 | Monthly % Change | Yr./Yr. % Change | October 2025 | Monthly % Change | Yr./Yr. % Change |
| Composite | $664,300 | -1.3 | -6.9 | $690,000 | -1.6 | -6.5 |
| Single Family | $784,000 | -1.3 | -4.6 | $730,400 | -1.7 | -5.9 |
| Townhouse | $548,700 | 0.1 | -7.7 | $598,300 | -2.1 | -4.8 |
| Apartment | $394,200 | -3.0 | -10.3 | $448,900 | -0.9 | -6.5 |
The Bank of Canada’s recent 0.25% rate cut and its hint that rates may hold steady could give home buyers the confidence to get preapproved for a mortgage. With a good number of homes for sale in Waterloo Region, now is a good time to start looking for your next home in case we see a surge in activity into the new year.
There were 1,236 new listings added last month, an increase 7.2 per cent compared to October last year and a 28.7 per cent increase compared to the previous ten-year average for October.
The total number of homes available for sale in active status at the end of October was 2,056, an increase of 23.6 per cent compared to October of last year and 90.2 per cent above the previous ten-year average of 1,081 listings for October.
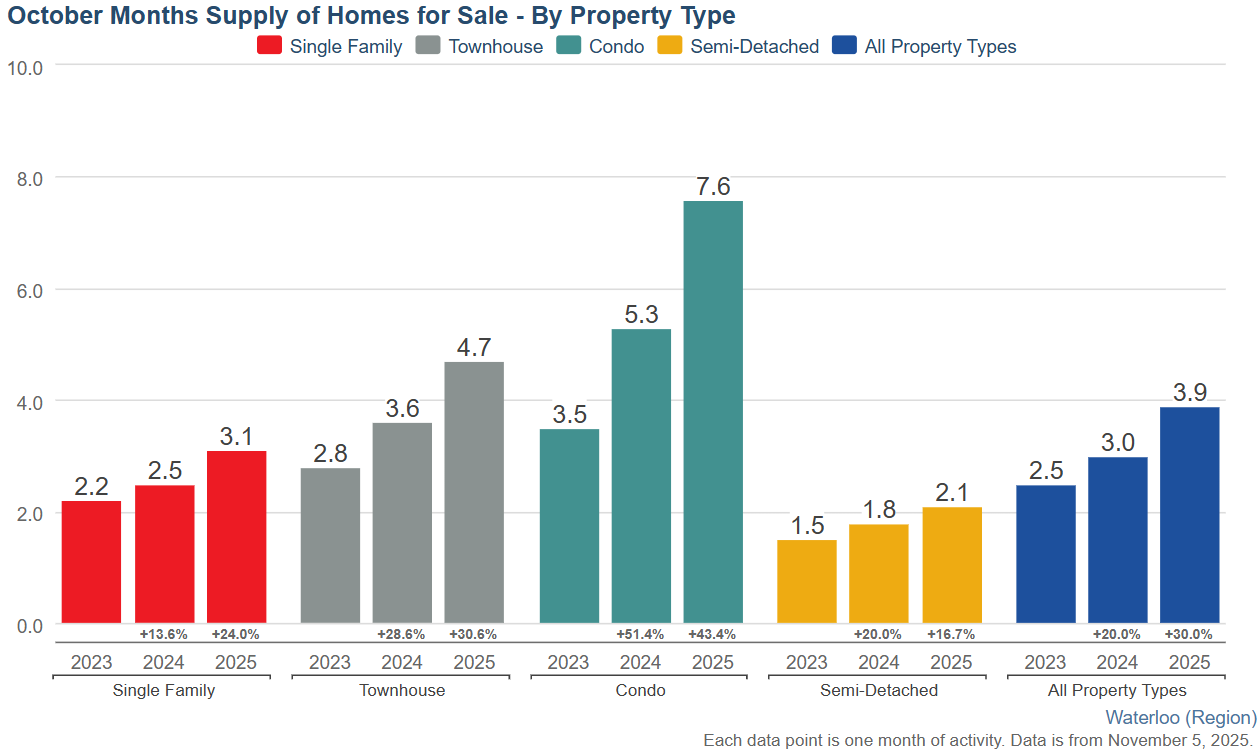
The total inventory across the market increased by 30.0 percent, resulting in a 3.9-month supply of all property types by the end of October. Condominium apartments had the highest inventory, with 7.6 months’ supply, followed by townhouses with 4.7 months’ supply and detached homes with 3.1 months’ supply. The number of months of inventory represents the time it would take to sell all current inventories at the current sales rate.
The average time to sell a home in October was 31 days, one day less than the previous month. In October 2024, it took 27 days for a home to sell, and the five-year average was 19 days.
Average Sales Price – Municipality
Average Sales Price – Township
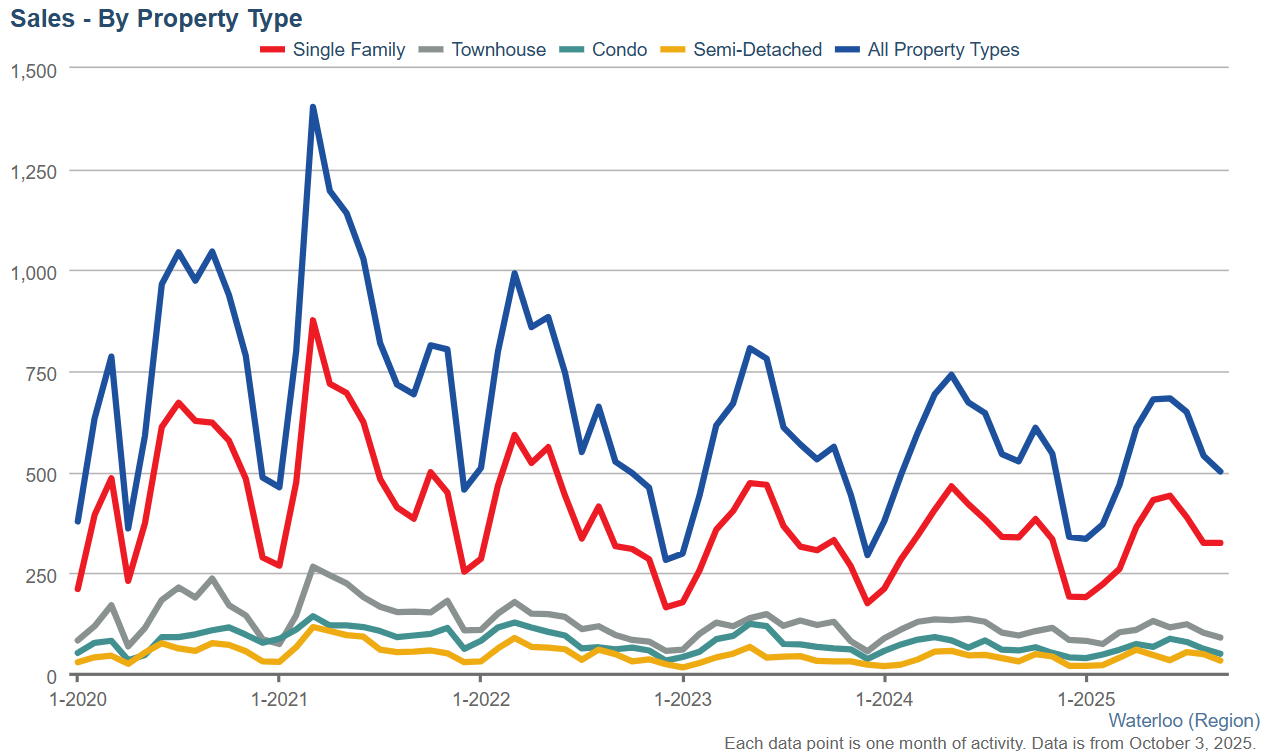
Monthly Sales By Property Type

Monthly Supply of Homes for Sale

Monthly Supply of Homes for Sale – By Property Type
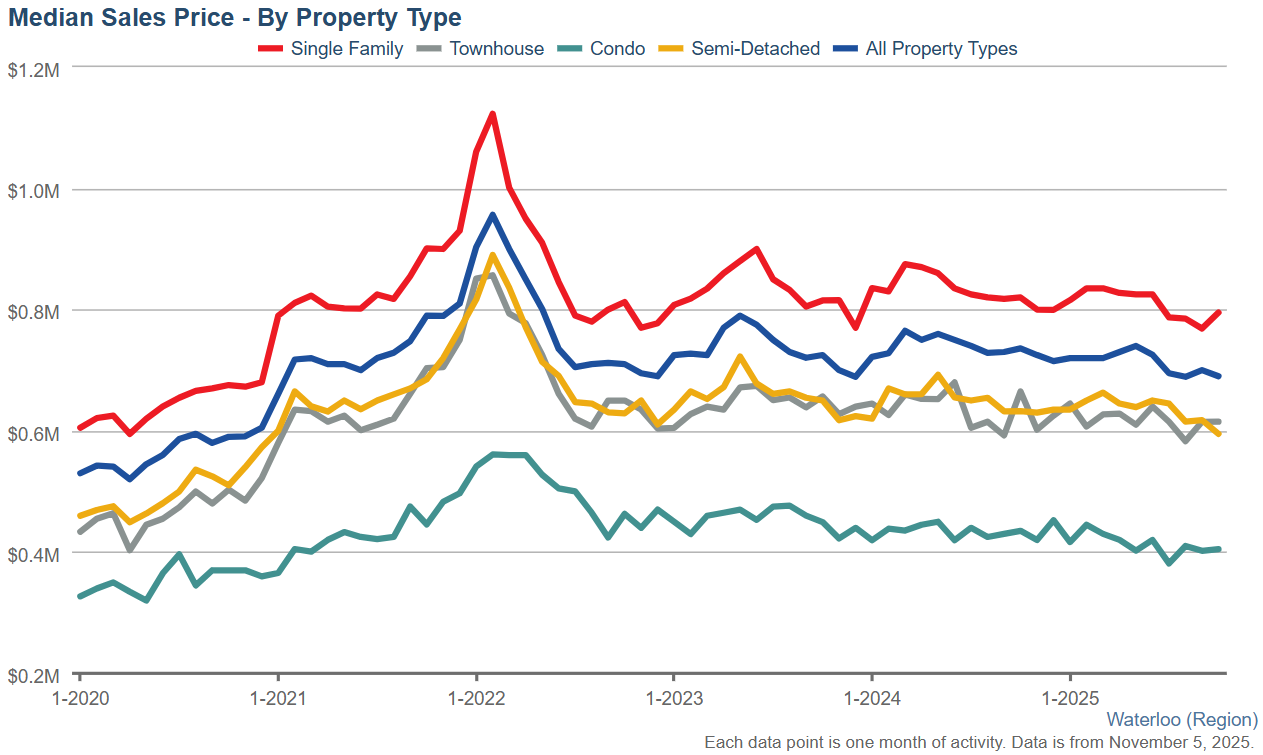
Monthly Median Sales Price – By Property Type
Monthly Average Sales Price – By Property Type

Monthly Average Days on Market

If you have any questions at all, are thinking of making a move this winter or are wondering what your home might be worth, give me a call or text to 519-497-4646 or shoot me an email to kevinbakerrealestate@gmail.com and we can sit down for a coffee and chat about your family’s needs going forward.
Have a great week!
Kevin
Kitchener Waterloo condo market remains Soft going into fall
I hope you had a wonderful weekend. We have been having some great weather so far this fall and I hope it continues.
The stats are out for September and things seem to be pretty balanced. We did see an uptick in activity in the past month so fingers crossed that it continues into the rest of fall. Let’s take a look at the stats…
In September, a total of 502 homes were sold. This represents a 4.7 per cent decrease compared to the same period last year and a decline of 25.0 per cent compared to the average number of homes sold in the previous ten years for the same month.
The September housing market continues to reflect broader economic conditions, with sales remaining below both last year’s levels and the ten-year average. While sales volumes have moderated from last year, this shift has created a more balanced market where buyers can take time with their decisions. Well-priced properties continue to attract attention, while homes that are priced above market value seem to be sitting on the market much longer than they should.
Total residential sales in September included 325 detached homes (down 4.1 per cent from September 2024), and 91 townhouses (down 5.2 per cent). Sales also included 51 condominium units (down 13.6 per cent) and 34 semi-detached homes (up 6.3 per cent).
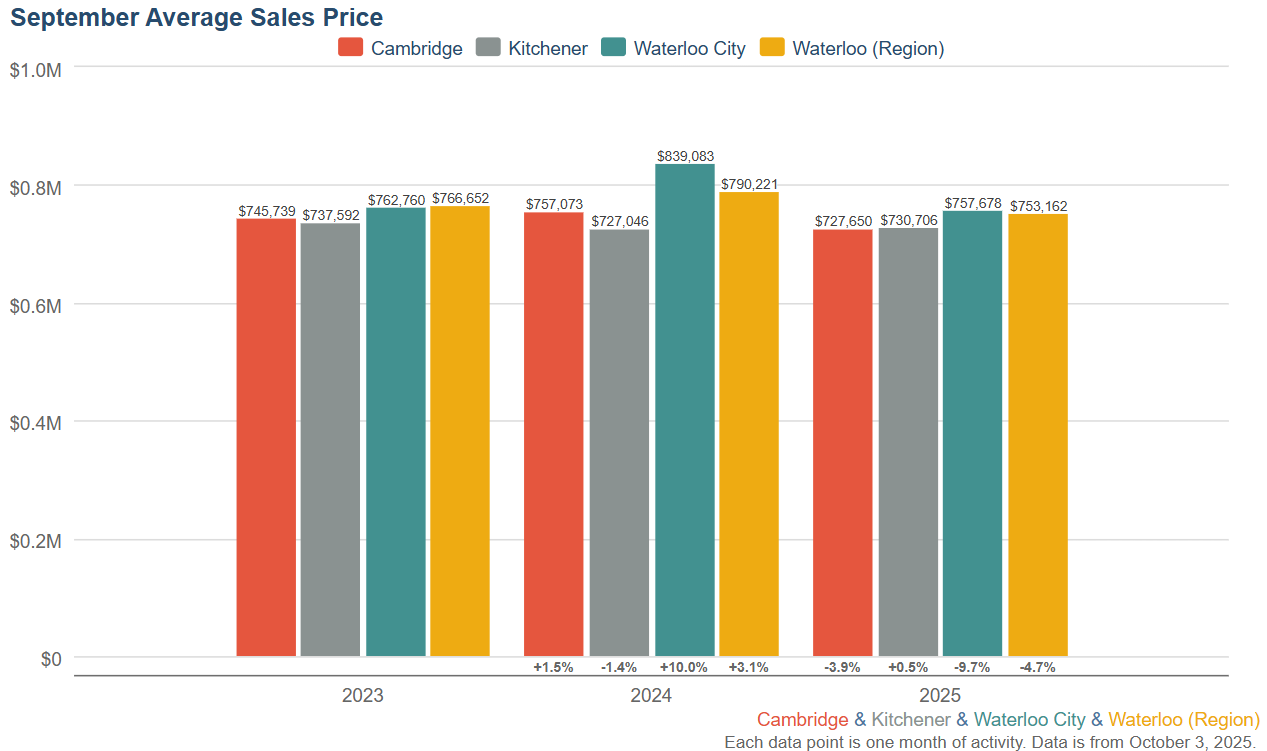
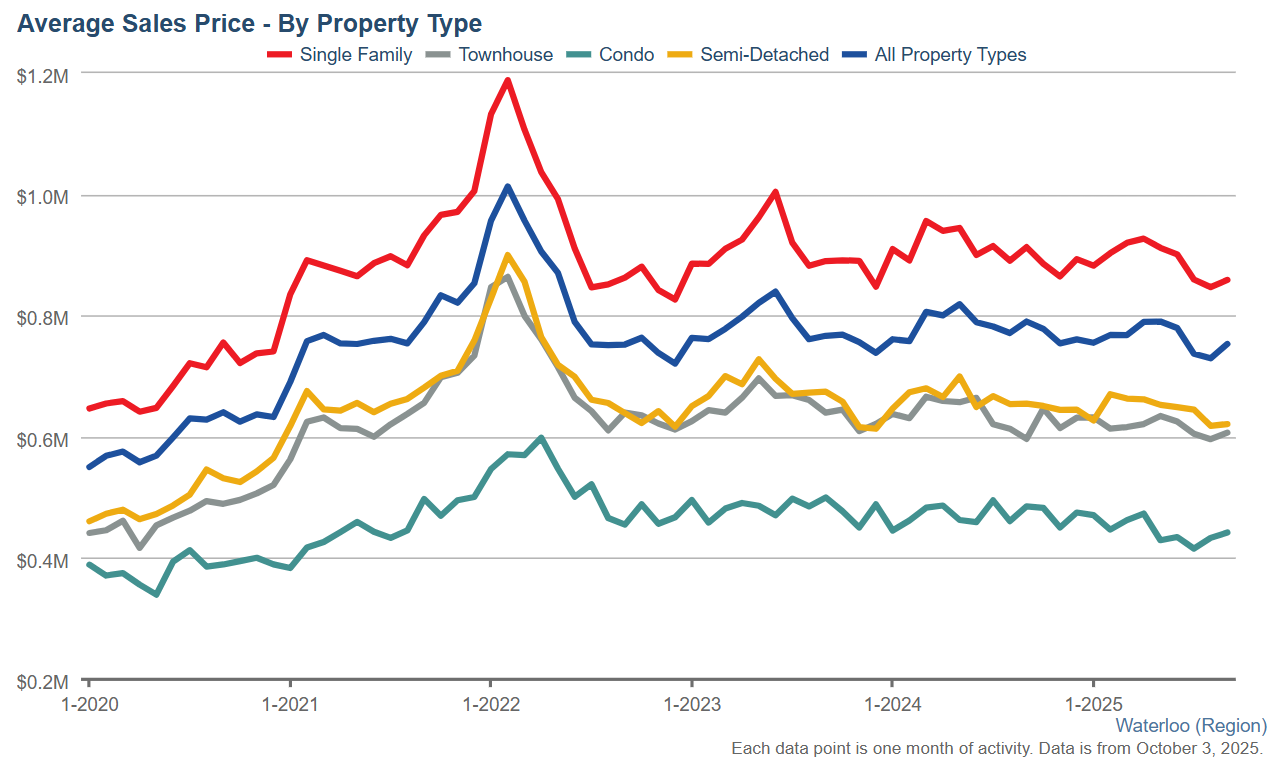
In September, the average sale price for all residential properties in Waterloo Region was $753,162. This represents a 4.7 per cent decrease compared to September 2024 and a 3.2 per cent increase compared to August 2025.
- The average sale price of a detached home was $858,872. This represents a 5.9 per cent decrease from September 2024 and an increase of 1.4 per cent compared to August 2025.
- The average sale price for a townhouse was $606,871. This represents a 1.7 per cent increase from September 2024 and an increase of 1.8 per cent compared to August 2025.
- The average sale price for an apartment-style condominium was $442,086. This represents a 8.9 per cent decrease from September 2024 and an increase of 2.0 per cent compared to August 2025.
- The average sale price for a semi was $621,026. This represents a decrease of 5.1 per cent compared to September 2024 and an increase of 0.5 per cent compared to August 2025.

| MLS® Home Price Index Benchmark Price (HPI) | ||||||
| Kitchener-Waterloo | Cambridge | |||||
| Benchmark Type: | September 2025 | Monthly % Change | Yr./Yr. % Change | September 2025 | Monthly % Change | Yr./Yr. % Change |
| Composite | $673,100 | -0.3 | -7.6 | $701,700 | 0.1 | -5.4 |
| Single Family | $794,600 | -0.1 | -5.9 | $742,700 | 0.1 | -4.5 |
| Townhouse | $548,300 | -1.3 | -9.0 | $611,500 | 0.3 | -4.7 |
| Apartment | $406,200 | -0.9 | -6.8 | $453,100 | -0.4 | -5.9 |

There were 1,469 new listings added last month, an increase 11.0 per cent compared to September last year and a 32.9 per cent increase compared to the previous ten-year average for September.
The total number of homes available for sale in active status at the end of September was 2,094, an increase of 22.2 per cent compared to September of last year and 79.5 per cent above the previous ten-year average of 1,167 listings for September.
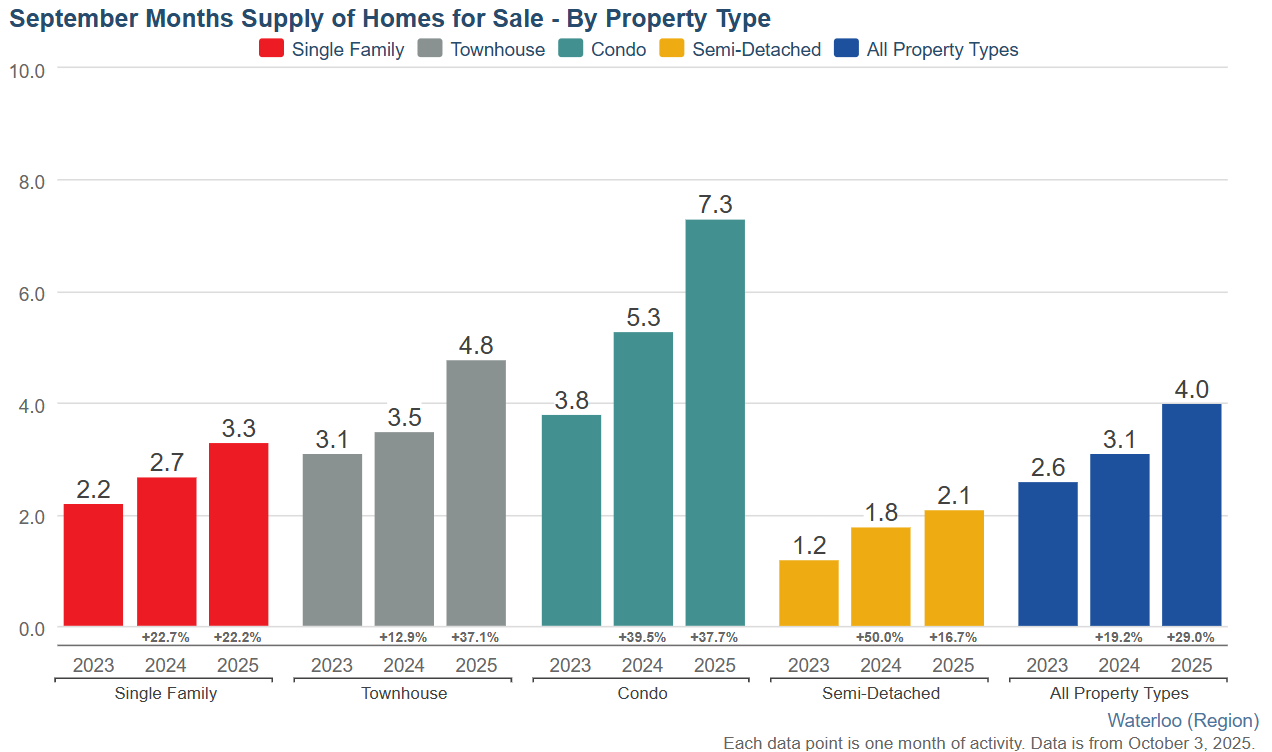
The total inventory across the market increased by 29.0 percent, resulting in a 4.0-month supply of all property types by the end of September. Condominium apartments had the highest inventory, with 7.3 months’ supply, followed by townhouses with 4.8 months’ supply and detached homes with 3.3 months’ supply. The number of months of inventory represents the time it would take to sell all current inventories at the current sales rate.
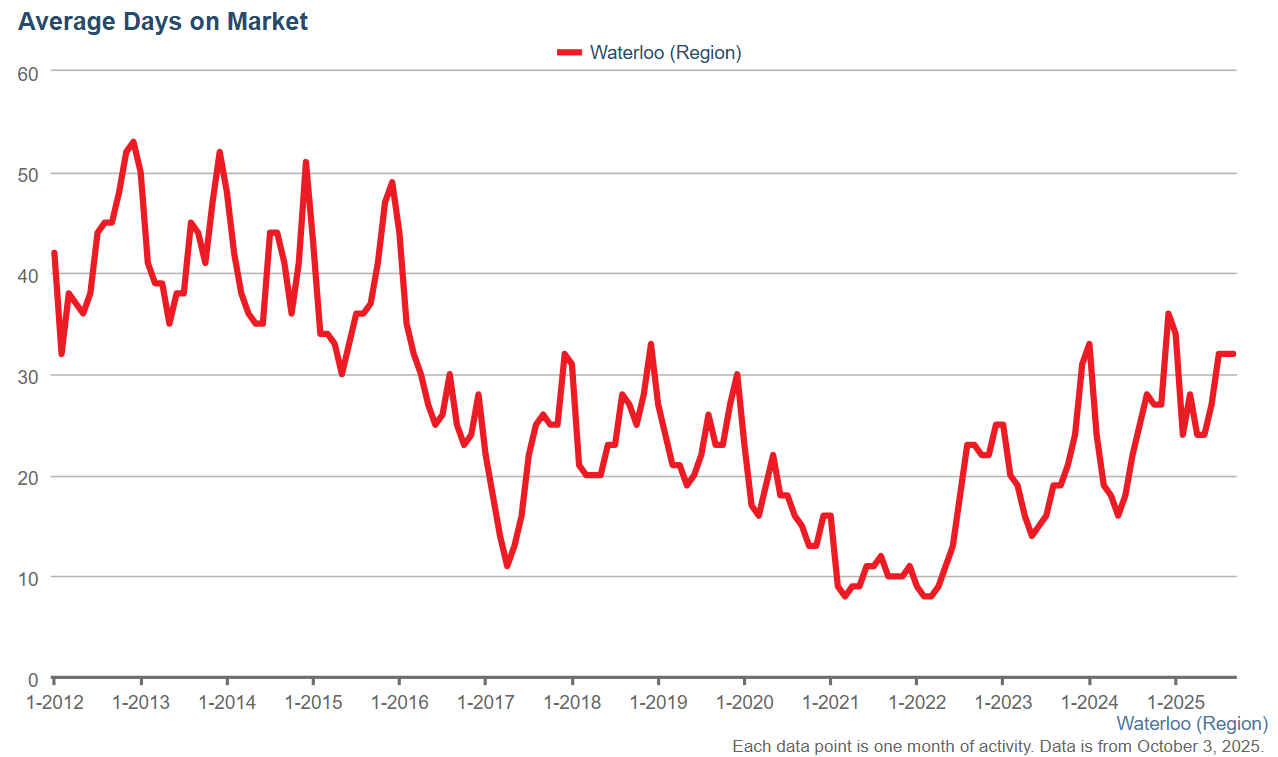
The average time to sell a home in September was 32 days, which was the same in the previous month. In September 2024, it took 28 days for a home to sell, and the five-year average was 19 days.
Average Sales Price – Municipality
Average Sales Price – Township
Monthly Sales By Property Type
Monthly Supply of Homes for Sale

Monthly Supply of Homes for Sale – By Property Type
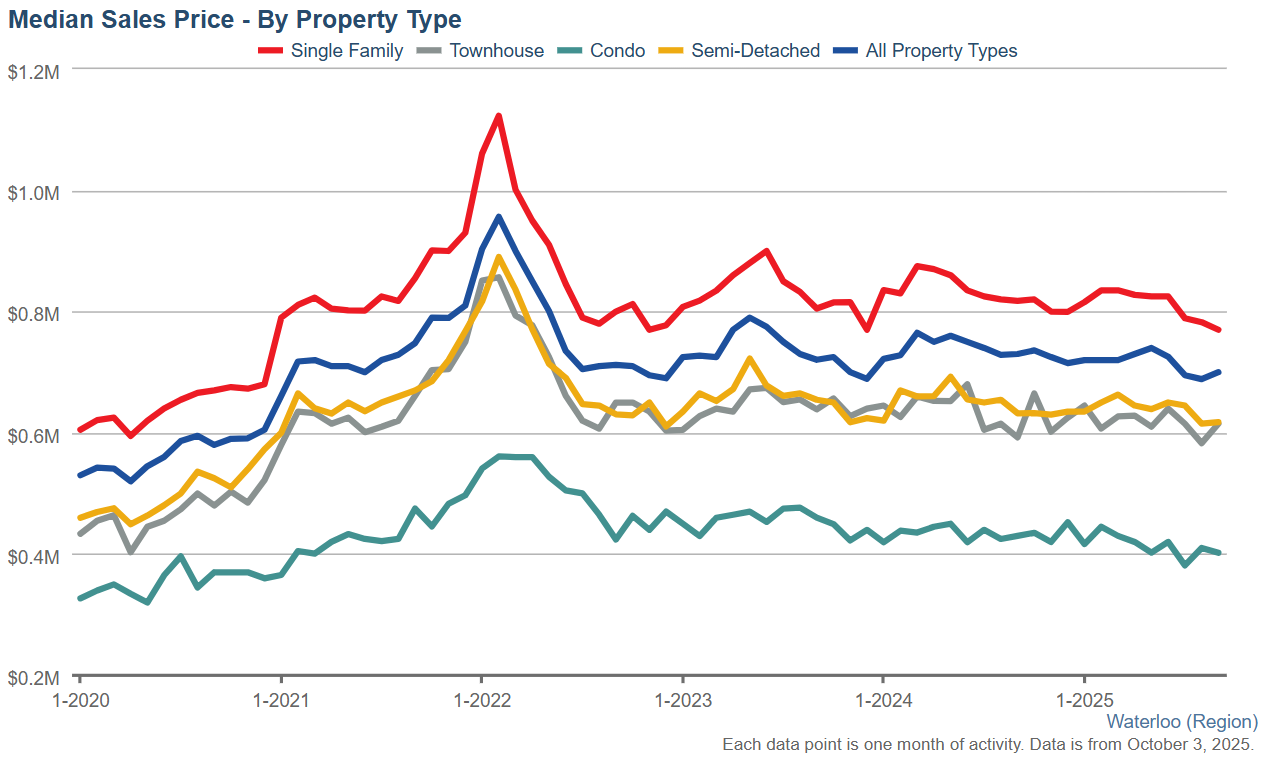
Monthly Median Sales Price – By Property Type
Monthly Average Sales Price – By Property Type
Monthly Average Days on Market
If you have any questions at all, are thinking of making a move this fall or are wondering what your home might be worth, give me a call or text to 519-497-4646 or shoot me an email to kevinbakerrealestate@gmail.com and we can sit down for a coffee and chat about your family’s needs going forward.
Have a great Thanksgiving next weekend with your families!
Kevin
Condo Market Still Struggles in August Here in Kitchener, Waterloo and Cambridge
I hope you had a wonderful labour day long weekend. Now that the kids are back in school routines should return back to normal. Remember to drive carefully around school zones, as the little ones settle in again.
The stats are out for August, let’s take a look and see what the market is doing here in Waterloo Region.
In August, a total of 536 homes were sold. This is a decrease of 1.3 per cent compared with the same period last year and a decline of 23.1 per cent compared to the average number of homes sold in the previous ten years for the same month.
The market is showing signs of stabilization, though we’re seeing a continued cooling trend compared to last year. While sales volumes have only slightly decreased year-over-year, the more notable change is in pricing, with most property types experiencing moderate downward pressure.
Total residential sales in August included 320 detached homes (down 5.6 per cent from August 2024), and 101 townhouses (down 1.0 per cent). Sales also included 62 condominium units (up 1.6 per cent) and 50 semi-detached homes (up 25.0 per cent).
In August, the average sale price for all residential properties in Waterloo Region was $728,465. This represents a 5.5 per cent decrease compared to August 2024 and a 1.0 per cent decrease compared to July 2025.
- The average sale price of a detached home was $846,405. This represents a 4.6 per cent decrease from August 2024 and a decrease of 1.3 per cent compared to July 2025.
- The average sale price for a townhouse was $594,200. This represents a 3.2 percent decrease from August 2024 and a 1.7 percent decrease compared to July 2025.
- The average sale price for an apartment-style condominium was $433,113. This represents a 6.0 per cent decrease from August 2024 and an increase of 4.2 per cent compared to July 2025.
- The average sale price for a semi was $618,206. This represents a 5.5 per cent decrease from August 2024 and a 4.1 per cent decrease compared to July 2025.
| MLS® Home Price Index Benchmark Price (HPI) | ||||||
| Kitchener-Waterloo | Cambridge | |||||
| Benchmark Type: | August 2025 | Monthly % Change | Yr./Yr. % Change | August 2025 | Monthly % Change | Yr./Yr. % Change |
| Composite | $675,400 | -0.4 | -7.1 | $701,100 | -1.5 | -5.6 |
| Single Family | $795,400 | -0.1 | -5.2 | $742,100 | -1.7 | -4.4 |
| Townhouse | $555,400 | -1.3 | -8.5 | $609,600 | -0.2 | -6.6 |
| Apartment | $409,900 | -0.2 | -7.1 | $455,200 | -0.5 | -5.7 |

There were 1,028 new listings added last month, an increase of 3.0 per cent compared to August last year and a 11.0 per cent increase compared to the previous ten-year average for August.
The average time to sell a home in August was 32 days, which is the same as the previous month. In August 2024, it took 25 days for a home to sell, and the five-year average was 19 days.
Despite the softer market conditions, we are encouraged by the healthy increase in new listings, which gives buyers more options. While our local market statistics indicate signs of stabilization, we are operating in a complex economic environment. The Bank of Canada’s decision to maintain interest rates at 2.75% for the third consecutive time provides some predictability for both buyers and sellers. However, economic uncertainty and the Bank’s focus on inflation, especially regarding shelter costs, remind us that we are in a period where both buyers and sellers need to stay informed.
If you have any questions at all, are thinking of making a move this fall or are wondering what your home might be worth, give me a call or text to 519-497-4646 or shoot me an email to kevinbakerrealestate@gmail.com and we can sit down for a coffee and chat about your family’s needs going forward.
Have a great rest of September!
Kevin
Waterloo Region Condo Sales see’s a Decrease in September
I hope you had a great week and are looking forward to the weekend. The weather has been so nice in September but I am sure fall is just around the corner. The stats are out for September in the Waterloo Region Housing market and Sales were down once again but prices were up slightly. Let’s take a look at the numbers…
In September, a total of 521 homes were sold in the Waterloo Region. This represents a decrease of 2.1 per cent compared to the same period last year and a decline of 23.5 per cent compared to the average number of homes sold in the previous ten years for the same month.
There has been an overall slowdown in home sales, but we continued to see strong demand for detached homes, resulting in an increase in sales for that specific type of property last month. The buyers have a bit more selection than a year ago as inventory is up, and homes take a little longer to sell. This can mean a less stressful homebuying experience, but for sellers, the current market may require more patience or even adjustment in price expectation.
Total residential sales in September included 336 detached homes (up 9.4 per cent from September 2023), and 95 townhouses (down 22.1 per cent). Sales also included 57 condominium units (down 16.2 per cent) and 32 semi-detached homes (down 3.0 per cent).
In September, the average sale price for all residential properties in Waterloo Region was $788,944. This represents a 2.9 per cent increase compared to September 2023 and a 2.3 per cent increase compared to August 2024.
- The average price of a detached home was $910,286. This represents a 2.3 per cent increase from September 2023 and an increase of 2.2 per cent compared to August 2024.
- The average sale price for a townhouse was $595,435. This represents a 6.9 per cent decrease from September 2023 and a decrease of 2.7 per cent compared to August 2024.
- The average sale price for an apartment-style condominium was $483,331. This represents a decrease of 3.4 per cent from September 2023 and an increase of 4.9 per cent compared to August 2024.
- The average sale price for a semi was $654,613. This represents a decrease of 2.9 per cent compared to September 2023 and an increase of 0.1 per cent compared to August 2024.
Average Sale Price – Monthly

| MLS® Home Price Index Benchmark Price | ||||||
| Kitchener-Waterloo | Cambridge | |||||
| Benchmark Type: | September 2024 | Monthly % Change | Yr./Yr. % Change | September 2024 | Monthly % Change | Yr./Yr. % Change |
| Composite | $728,700 | 0.2 | -1.8 | $741,800 | -0.1 | 0.0 |
| Single Family | $844,400 | 0.6 | 0.3 | $777,500 | 0.2 | 1.3 |
| Townhouse | $602,800 | -0.7 | -5.5 | $641,700 | -1.7 | -4.8 |
| Apartment | $435,700 | -1.3 | -8.3 | $481,500 | -0.2 | -4.2 |

In September, the federal government made some policy changes. These changes include extending mortgage terms to 30 years for first-time homebuyers and all buyers of new builds and raising the CMHC insurance cap from $1 million to $1.5 million. These changes will come into effect later this year. Combined with anticipated further interest rate cuts, these adjustments could enable more buyers to purchase their first home.
There were 1,313 new listings added last month, a decrease of 6.5 per cent compared to September last year and a 20.0 per cent increase compared to the previous ten-year average for September.
The total number of homes available for sale in active status at the end of September was 1,751 an increase of 21.3 per cent compared to September of last year and 42.2 per cent above the previous ten-year average of 1,232 listings for September.
The total inventory across the market increased by 23.1 percent, resulting in a 3.2-month supply of all property types by the end of September. Condominium apartments had the highest inventory, with 5.5 months’ supply, followed by townhouses with 3.6 months’ supply and detached homes with 2.7 months’ supply. The number of months of inventory represents the time it would take to sell off current inventories at the current sales rate.
The average time it took to sell a home in September was 28 days, which is three days longer than the previous month. In September 2023, it took 19 days for a home to sell, and the five-year average is 18 days.
If you have any questions at all, are thinking of making a move this fall and wondering what your home might be worth, give me a call or text to 519-497-4646 or shoot me an email to kevinbakerrealestate@gmail.com and we can sit down for a coffee and chat about your family’s needs going forward.
Enjoy your Thanksgiving with your families next weekend!
Kevin
Average Sales Price – Municipality

Average Sales Price – Township

Monthly Sales By Property Type

Monthly Supply of Homes for Sale

Monthly Supply of Homes for Sale – By Property Type

Monthly Median Sales Price – By Property Type

Monthly Average Sales Price – By Property Type

Monthly Average Days on Market

