
Rising Inventory and Declining Sales the Trend for Waterloo Regions Housing Market in 2025
I hope you are having a wonderful holiday season with your families. I myself ate a little too much but really enjoyed getting together with family and friends over Christmas and New Years.
Now that 2026 has started, the kids are back to school, I notice the gym is a little busier each day that I am there but that’s great, hopefully everyone can keep their new years resolutions!
The stats are out for last year for the real estate market so lets take a look…
There were 6,177 homes sold in Waterloo Region in 2025, a decrease of 8.8 per cent compared to 2024, and a 25.3 per cent compared to the previous ten-year average for annual sales.
On a monthly basis, 306 homes were sold in December, a decrease of 9.5 per cent compared to the same period last year and a decrease of nearly 19.5 per cent compared to the average number of homes sold in the previous ten years for the same month.
In Waterloo Region, we observed an increase in new listings coming onto the market in 2025, accompanied by softening sales and longer selling times. This trend occurred during a year when affordability remained a challenge for many aspiring homebuyers, as global and economic uncertainty contributed to a weaker housing market. With the downward pressure on housing prices, and more options for buyers, it proved to be a good year for those first-time buyers who were able to get into the market.
Total residential sales in December included 192 detached homes (no change from December 2024), and 52 townhouses (down 39.1 per cent). Sales also included 35 condominium units (down 14.6 per cent) and 26 semi-detached homes (up 23.8 per cent).
For 2025, total residential sales included 3,779 detached (down 7.7 per cent), and 1,174 townhouses (down 14.4 per cent). Sales also included 727 condominium units (down 11.6 per cent) and 484 semi-detached homes (up 1.5 per cent).
In December, the average sale price for all residential properties in Waterloo Region was $716,911. This represents a 5.9 per cent decrease compared to December 2024 and a 0.5 per cent increase compared to November 2025.
- The average sale price of a detached home was $839,394. This represents a 6.0 per cent decrease from December 2024 and an increase of 1.4 per cent compared to November 2025.
- The average sale price for a townhouse was $568,249. This represents a 9.8 per cent decrease from December 2024 and a decrease of 4.4 per cent compared to November 2025.
- The average sale price for an apartment-style condominium was $366,784. This represents a 22.9 per cent decrease from December 2024 and a decrease of 13.1 per cent compared to November 2025.
- The average sale price for a semi was $601,535. This represents a decrease of 6.7 per cent compared to December 2024 and a decrease of 5.6 per cent compared to November 2025.

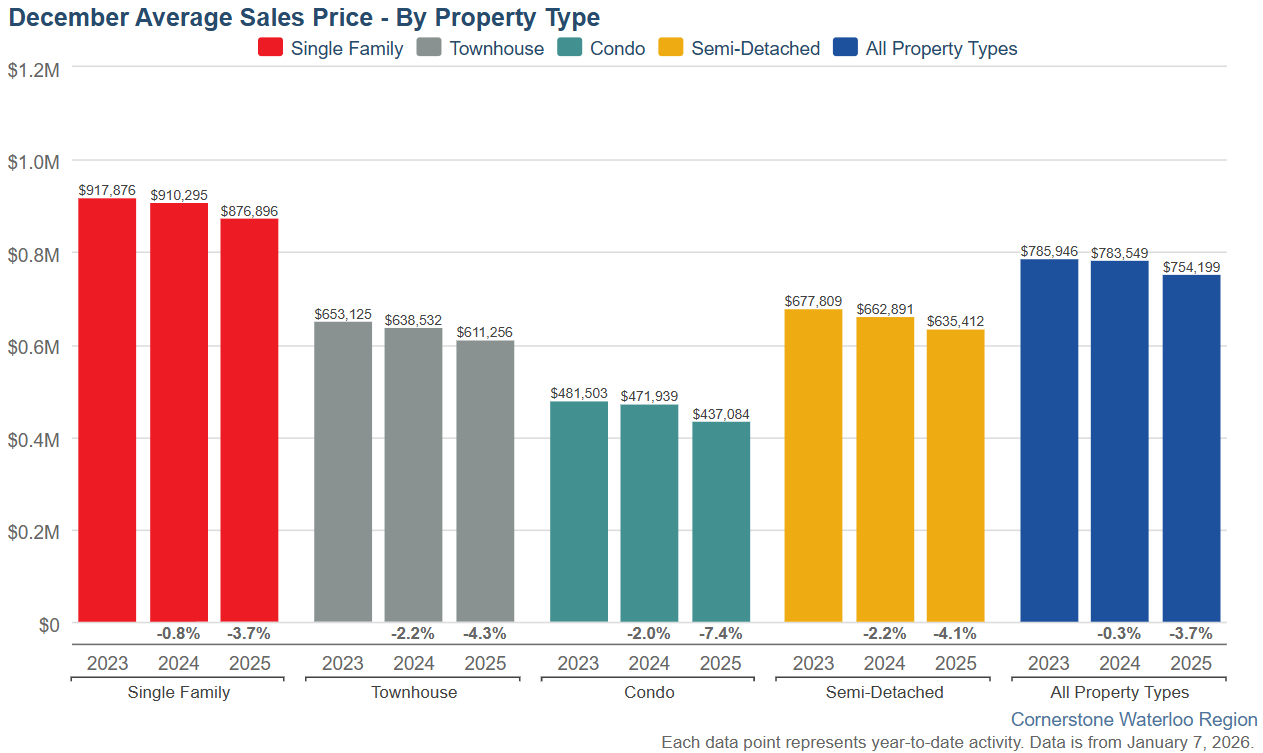
Year-to-date, the average sale price for all residential properties in Waterloo Region decreased 3.7 per cent to $754,199 compared to 2024.
- The year-to-date average price of a detached home was $876,896. This represents a 3.7 per cent decrease compared to 2024.
- The year-to-date average sale price for a townhouse was $611,256. This represents a 4.3 per cent decrease compared to 2024.
- The year-to-date average sale price for an apartment-style condominium was $437,084. This represents a 7.4 per cent decrease compared to 2024.
- The year-to-date average sale price for a semi was $635,412. This represents a decrease of 4.1 per cent compared to 2024.
| Monthly MLS® Home Price Index Benchmark Price (HPI) | ||||||
| Kitchener-Waterloo | Cambridge | |||||
| Benchmark Type: | December 2025 | Monthly % Change | Yr./Yr. % Change | December 2025 | Monthly % Change | Yr./Yr. % Change |
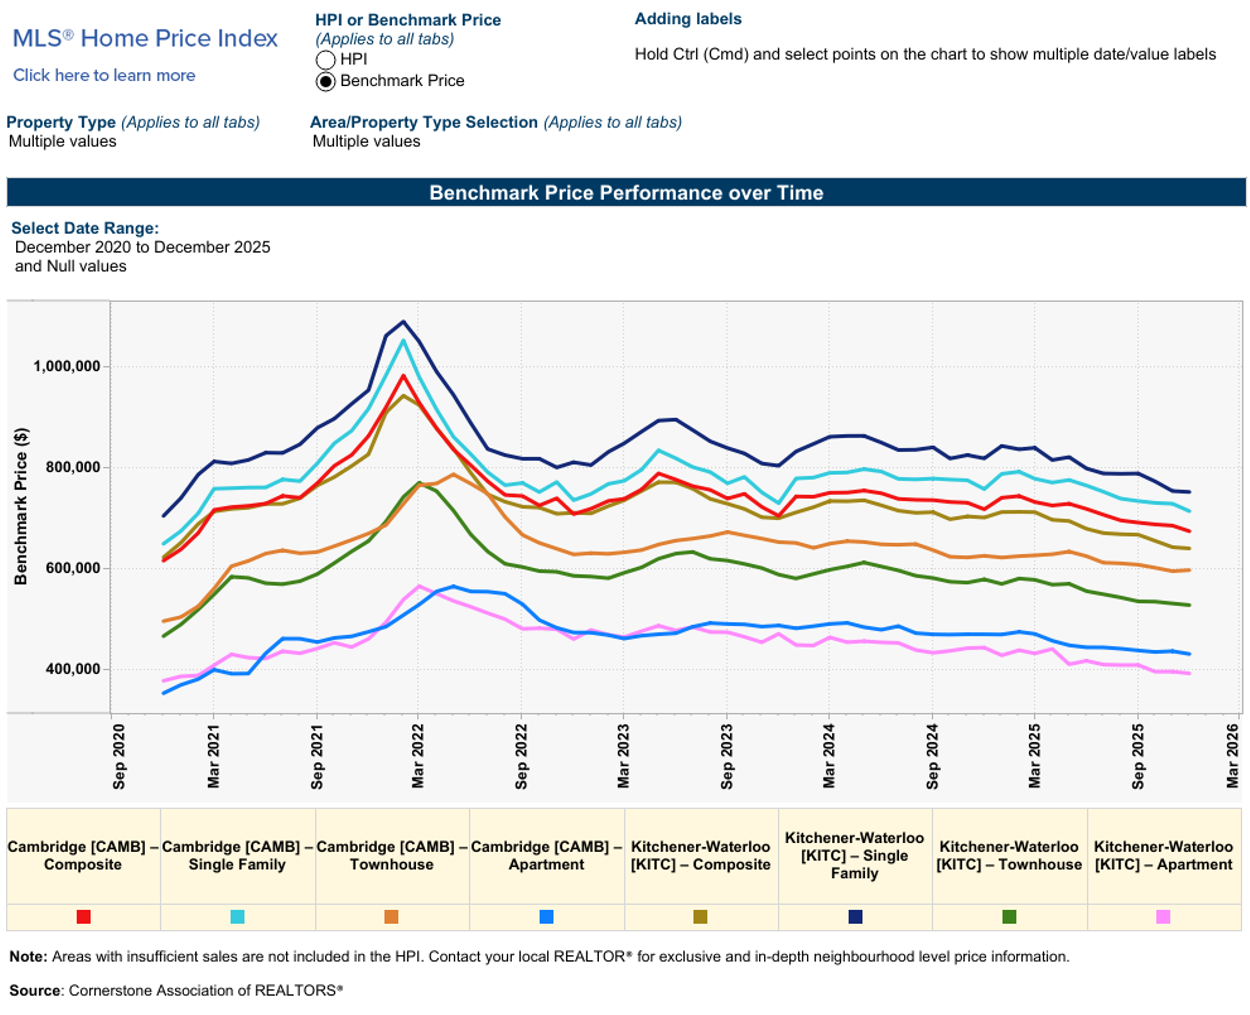
| Composite | $640,100 | -0.4 | -8.8 | $674,300 | -1.6 | -6.1 |
| Single Family | $752,200 | -0.3 | -8.1 | $714,100 | -2.0 | -5.8 |
| Townhouse | $527,600 | -0.6 | -8.8 | $597,100 | -0.4 | -4.5 |
| Apartment | $392,000 | -0.9 | -11.6 | $430,600 | -1.3 | -8.3 |
| Annual MLS® Home Price Index Benchmark Price | ||||
| Kitchener-Waterloo | Cambridge | |||
| Benchmark Type: | 2025 | Yr./Yr. % Change | 2025 | Yr./Yr. % Change |
| Composite | $679,600 | -5.4% | $712,200 | -4.0% |
| Detached | $799,800 | -5.1% | $756,300 | -3.4% |
| Townhouse | $554,400 | -6.3% | $617,500 | -4.0% |
| Apartment | $415,500 | -7.50% | $451,600 | -5.9% |
There were 375 new listings added last month, an increase of 6.5 per cent compared to December last year, and an 11.3 per cent increase compared to the previous ten-year average for December.
In 2025, 13,872 new listings were added, an increase of 5.2 per cent compared to 2024, and a 15.7 per cent increase compared to the previous ten-year annual average.
At the end of December, there were 1,188 homes available for sale in active status, representing a 15.9% increase from the same month last year. This number surpasses the previous ten-year average of 595 homes in December.
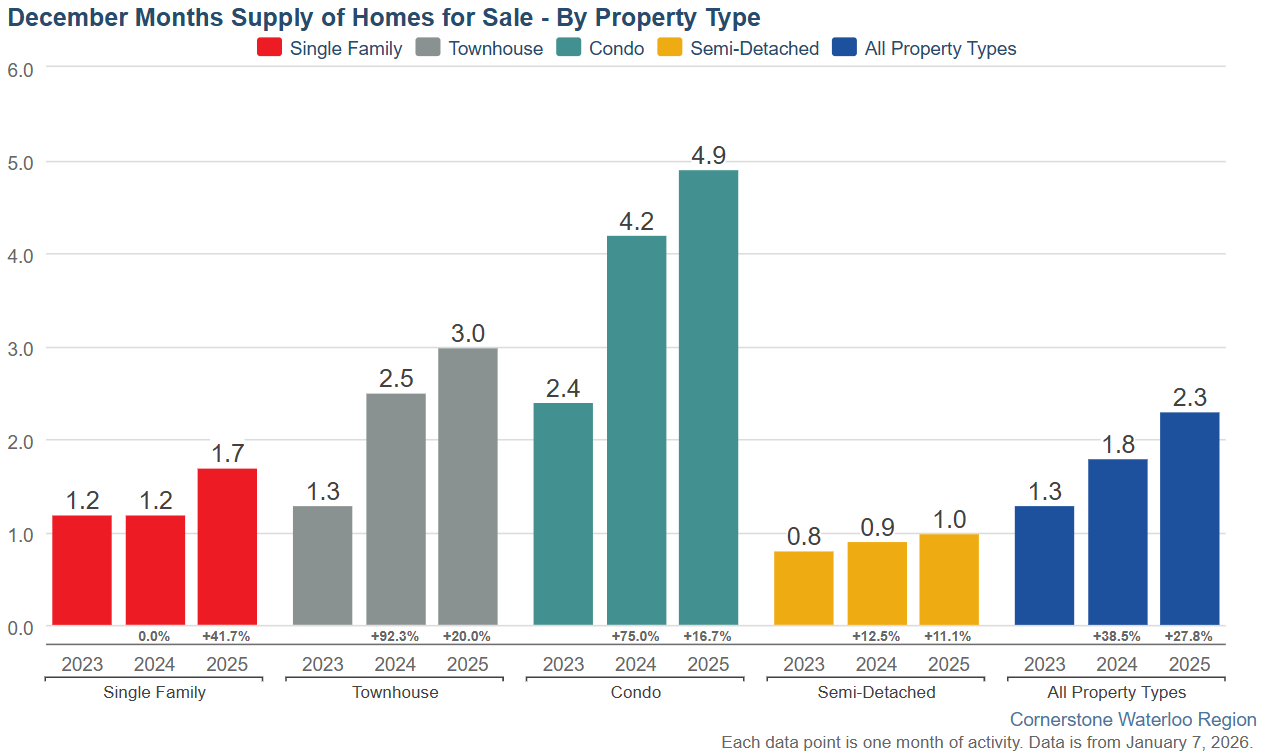
The total inventory across the market increased by 27.8 percent, resulting in a 2.3-month supply of all property types by the end of December. Condominium apartments had the highest inventory, with 4.9 months’ supply, followed by townhouses with 3.0 months’ supply and detached homes with 1.7 months’ supply. The number of months of inventory represents the time it would take to sell all current inventories at the current sales rate.
The average time to sell a home in December was 45 days, which is 6 days longer than the previous month. In December 2024, it took 36 days for a home to sell, and the five-year average was 24 days.
Average Sales Price – Municipality
Average Sales Price – Township
Monthly Sales By Property Type
Monthly Supply of Homes for Sale
Monthly Median Sales Price – By Property Type
Monthly Average Sales Price – By Property Type
Monthly Average Days on Market
Monthly Number of New Listings – By Property Type
Monthly Homes for Sale
Monthly Supply of Homes for Sale – By Property Type
If you have any questions at all, are thinking of making a move this winter into spring, or are wondering what your home might be worth, give me a call or text to 519-497-4646 or shoot me an email to kevinbakerrealestate@gmail.com and we can sit down for a coffee and chat about your family’s needs going forward.
Have a great weekend!
Kevin
Condo Sales Down in October in Waterloo Region
I hope you are having a wonderful weekend. Looks like we have snow in the region today but hopefully it doesn’t stay too long. I am sure we will be hearing Christmas music on the radio soon enough.
The Real estate market stats are out for October and things seem to have taken a bump up in the first 2 weeks of October but that was short lived with the market slowing down again near the end of the month. Let’s take a look at the breakdowns.
There were 569 homes sold last month. This represents a 6.7 per cent decrease compared to the same period last year and a decline of 18.4 per cent compared to the average number of homes sold in the previous ten years for the same month.
While October home sales in Waterloo Region lag behind historical averages, activity did pick up compared to September. With more listings available than we typically see this time of year and borrowing costs beginning to ease, buyers have the opportunity to explore a wider range of options.
Total residential sales in October included 371 detached homes (down 3.4 per cent from October 2024), and 89 townhouses (down 16.8 per cent). Sales also included 56 condominium units (down 16.4 per cent) and 49 semi-detached homes (down 2.0 per cent).
In October, the average sale price for all residential properties in Waterloo Region was $734,928. This represents a 5.6 per cent decrease compared to October 2024 and a 2.4 per cent decrease compared to September 2025.
- The average sale price of a detached home was $842,907. This represents a 4.8 per cent decrease from October 2024 and a decrease of 1.6 per cent compared to September 2025.
- The average sale price for a townhouse was $593,652. This represents an 8.2 per cent decrease from October 2024 and a decrease of 2.2 per cent compared to September 2025.
- The average sale price for an apartment-style condominium was $433,746. This represents a 10.2 per cent decrease from October 2024 and a decrease of 1.9 per cent compared to September 2025.
- The average sale price for a semi was $573,332. This represents a decrease of 11.9 per cent compared to October 2024 and a decrease of 7.7 per cent compared to September 2025.

| MLS® Home Price Index Benchmark Price (HPI) | ||||||
| Kitchener-Waterloo | Cambridge | |||||
| Benchmark Type: | October 2025 | Monthly % Change | Yr./Yr. % Change | October 2025 | Monthly % Change | Yr./Yr. % Change |
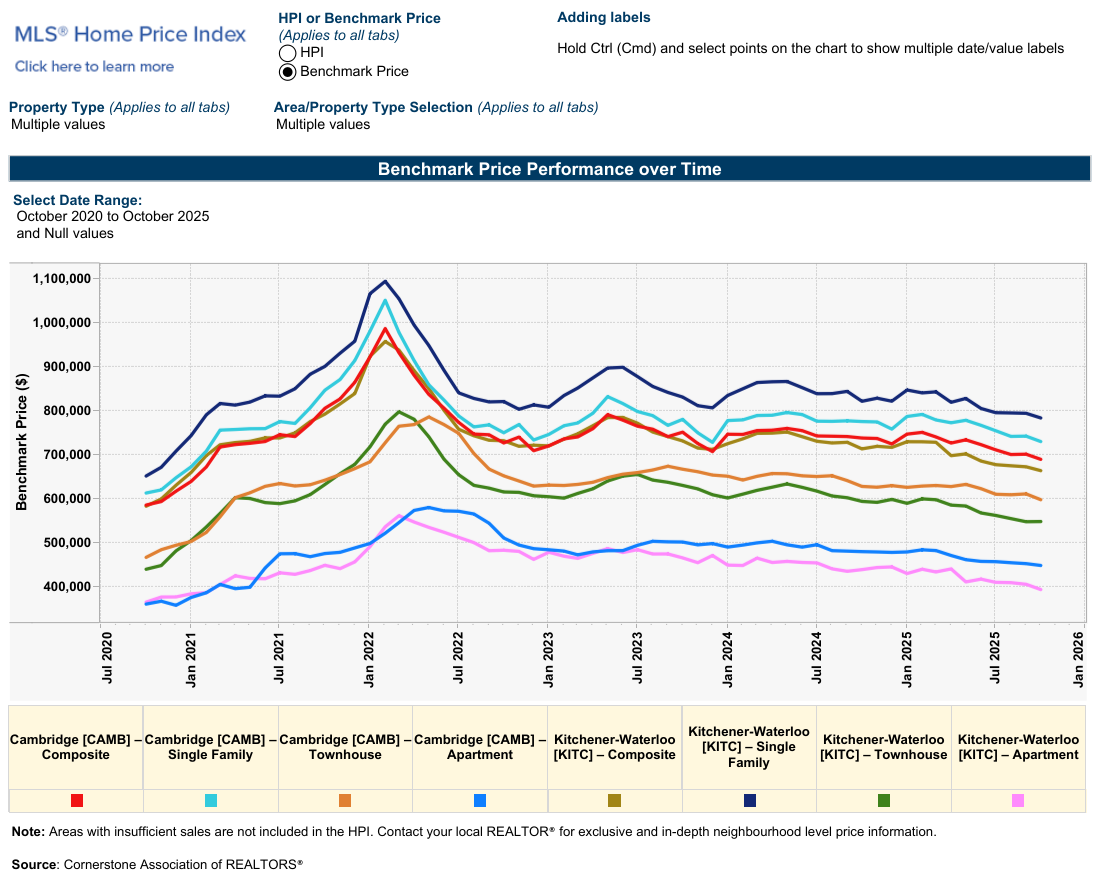
| Composite | $664,300 | -1.3 | -6.9 | $690,000 | -1.6 | -6.5 |
| Single Family | $784,000 | -1.3 | -4.6 | $730,400 | -1.7 | -5.9 |
| Townhouse | $548,700 | 0.1 | -7.7 | $598,300 | -2.1 | -4.8 |
| Apartment | $394,200 | -3.0 | -10.3 | $448,900 | -0.9 | -6.5 |
The Bank of Canada’s recent 0.25% rate cut and its hint that rates may hold steady could give home buyers the confidence to get preapproved for a mortgage. With a good number of homes for sale in Waterloo Region, now is a good time to start looking for your next home in case we see a surge in activity into the new year.
There were 1,236 new listings added last month, an increase 7.2 per cent compared to October last year and a 28.7 per cent increase compared to the previous ten-year average for October.
The total number of homes available for sale in active status at the end of October was 2,056, an increase of 23.6 per cent compared to October of last year and 90.2 per cent above the previous ten-year average of 1,081 listings for October.
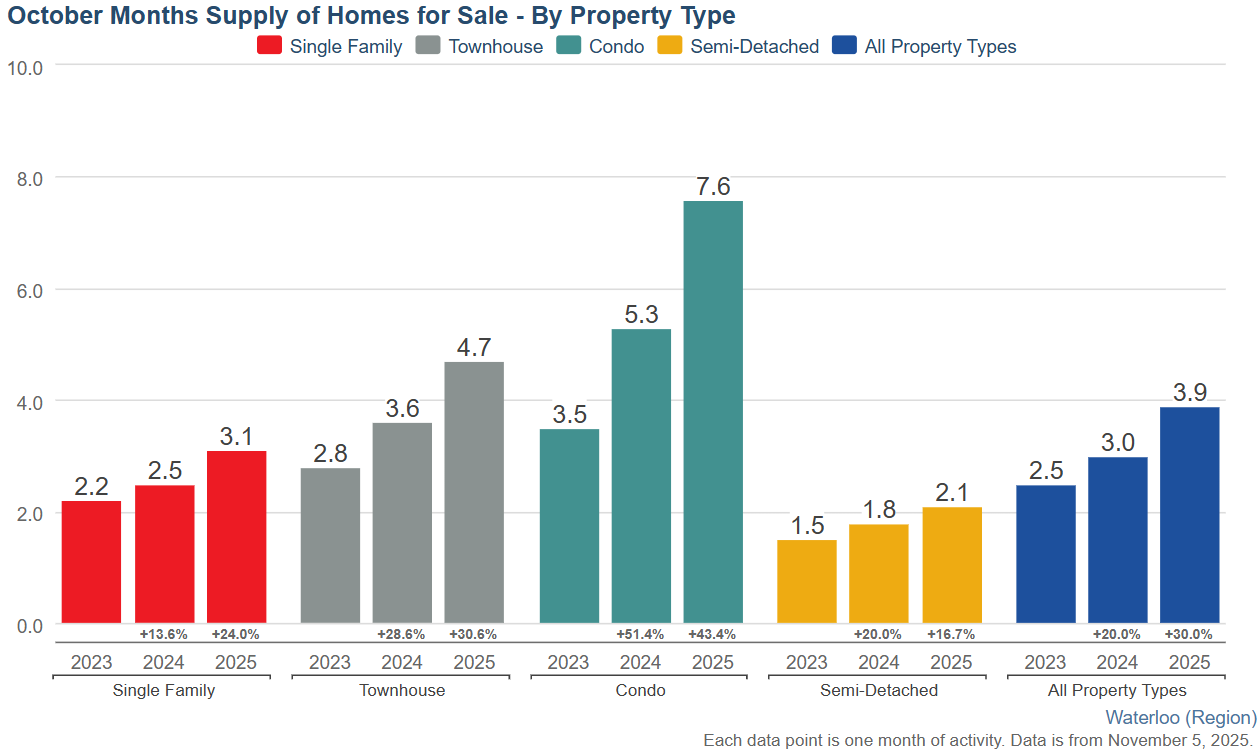
The total inventory across the market increased by 30.0 percent, resulting in a 3.9-month supply of all property types by the end of October. Condominium apartments had the highest inventory, with 7.6 months’ supply, followed by townhouses with 4.7 months’ supply and detached homes with 3.1 months’ supply. The number of months of inventory represents the time it would take to sell all current inventories at the current sales rate.
The average time to sell a home in October was 31 days, one day less than the previous month. In October 2024, it took 27 days for a home to sell, and the five-year average was 19 days.
Average Sales Price – Municipality
Average Sales Price – Township
Monthly Sales By Property Type

Monthly Supply of Homes for Sale

Monthly Supply of Homes for Sale – By Property Type
Monthly Median Sales Price – By Property Type
Monthly Average Sales Price – By Property Type

Monthly Average Days on Market

If you have any questions at all, are thinking of making a move this winter or are wondering what your home might be worth, give me a call or text to 519-497-4646 or shoot me an email to kevinbakerrealestate@gmail.com and we can sit down for a coffee and chat about your family’s needs going forward.
Have a great week!
Kevin
Kitchener Waterloo condo market remains Soft going into fall
I hope you had a wonderful weekend. We have been having some great weather so far this fall and I hope it continues.
The stats are out for September and things seem to be pretty balanced. We did see an uptick in activity in the past month so fingers crossed that it continues into the rest of fall. Let’s take a look at the stats…
In September, a total of 502 homes were sold. This represents a 4.7 per cent decrease compared to the same period last year and a decline of 25.0 per cent compared to the average number of homes sold in the previous ten years for the same month.
The September housing market continues to reflect broader economic conditions, with sales remaining below both last year’s levels and the ten-year average. While sales volumes have moderated from last year, this shift has created a more balanced market where buyers can take time with their decisions. Well-priced properties continue to attract attention, while homes that are priced above market value seem to be sitting on the market much longer than they should.
Total residential sales in September included 325 detached homes (down 4.1 per cent from September 2024), and 91 townhouses (down 5.2 per cent). Sales also included 51 condominium units (down 13.6 per cent) and 34 semi-detached homes (up 6.3 per cent).
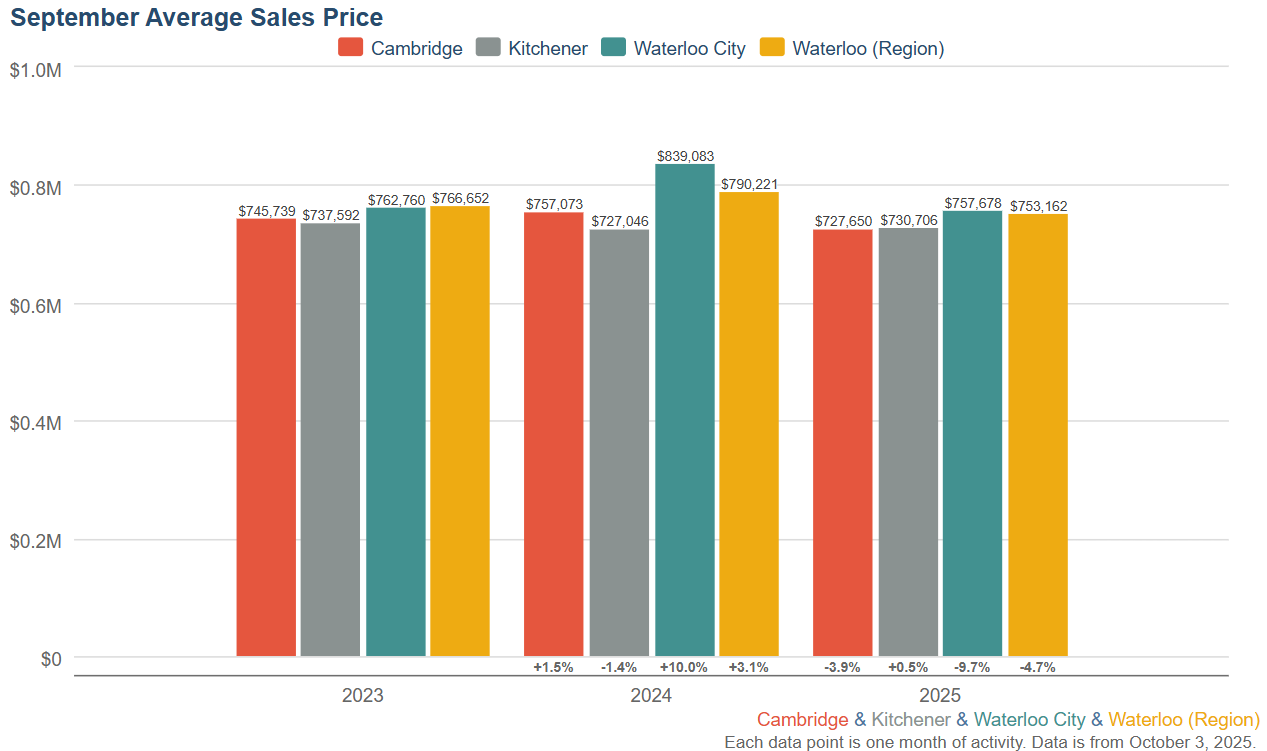
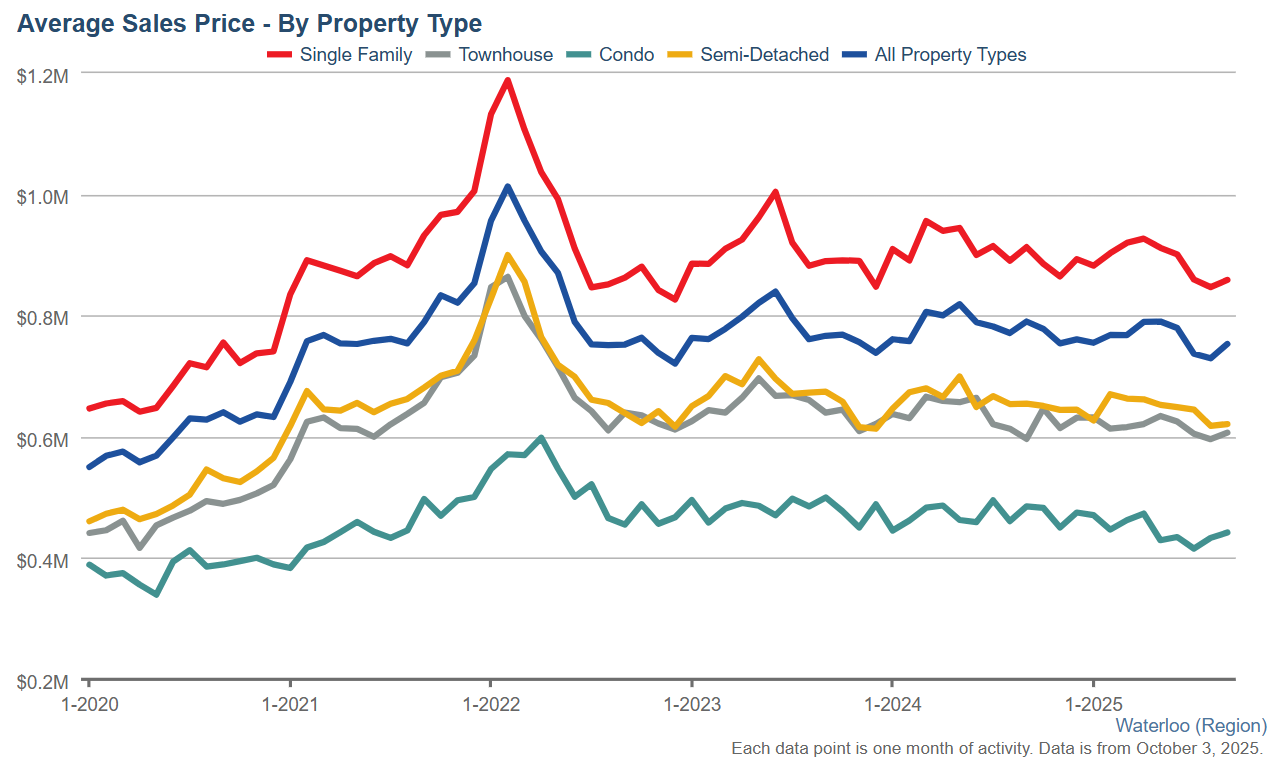
In September, the average sale price for all residential properties in Waterloo Region was $753,162. This represents a 4.7 per cent decrease compared to September 2024 and a 3.2 per cent increase compared to August 2025.
- The average sale price of a detached home was $858,872. This represents a 5.9 per cent decrease from September 2024 and an increase of 1.4 per cent compared to August 2025.
- The average sale price for a townhouse was $606,871. This represents a 1.7 per cent increase from September 2024 and an increase of 1.8 per cent compared to August 2025.
- The average sale price for an apartment-style condominium was $442,086. This represents a 8.9 per cent decrease from September 2024 and an increase of 2.0 per cent compared to August 2025.
- The average sale price for a semi was $621,026. This represents a decrease of 5.1 per cent compared to September 2024 and an increase of 0.5 per cent compared to August 2025.

| MLS® Home Price Index Benchmark Price (HPI) | ||||||
| Kitchener-Waterloo | Cambridge | |||||
| Benchmark Type: | September 2025 | Monthly % Change | Yr./Yr. % Change | September 2025 | Monthly % Change | Yr./Yr. % Change |
| Composite | $673,100 | -0.3 | -7.6 | $701,700 | 0.1 | -5.4 |
| Single Family | $794,600 | -0.1 | -5.9 | $742,700 | 0.1 | -4.5 |
| Townhouse | $548,300 | -1.3 | -9.0 | $611,500 | 0.3 | -4.7 |
| Apartment | $406,200 | -0.9 | -6.8 | $453,100 | -0.4 | -5.9 |

There were 1,469 new listings added last month, an increase 11.0 per cent compared to September last year and a 32.9 per cent increase compared to the previous ten-year average for September.
The total number of homes available for sale in active status at the end of September was 2,094, an increase of 22.2 per cent compared to September of last year and 79.5 per cent above the previous ten-year average of 1,167 listings for September.
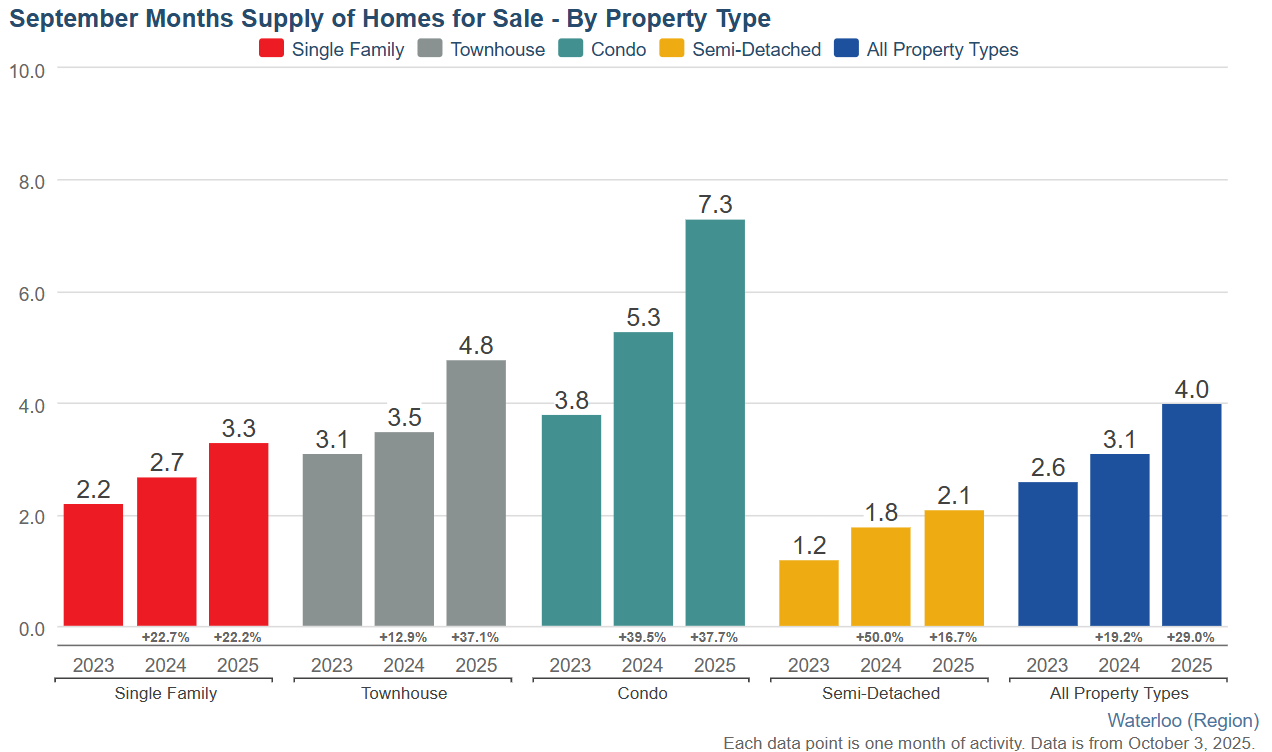
The total inventory across the market increased by 29.0 percent, resulting in a 4.0-month supply of all property types by the end of September. Condominium apartments had the highest inventory, with 7.3 months’ supply, followed by townhouses with 4.8 months’ supply and detached homes with 3.3 months’ supply. The number of months of inventory represents the time it would take to sell all current inventories at the current sales rate.
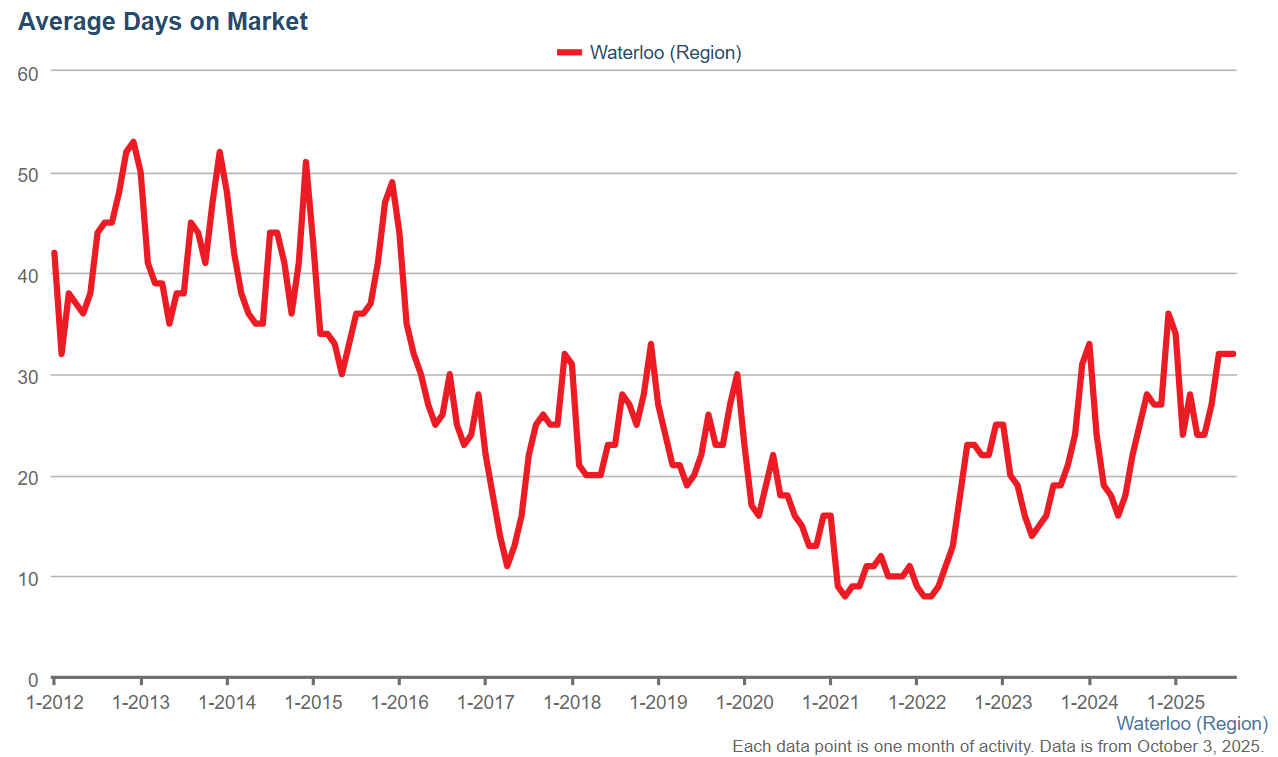
The average time to sell a home in September was 32 days, which was the same in the previous month. In September 2024, it took 28 days for a home to sell, and the five-year average was 19 days.
Average Sales Price – Municipality
Average Sales Price – Township
Monthly Sales By Property Type
Monthly Supply of Homes for Sale

Monthly Supply of Homes for Sale – By Property Type
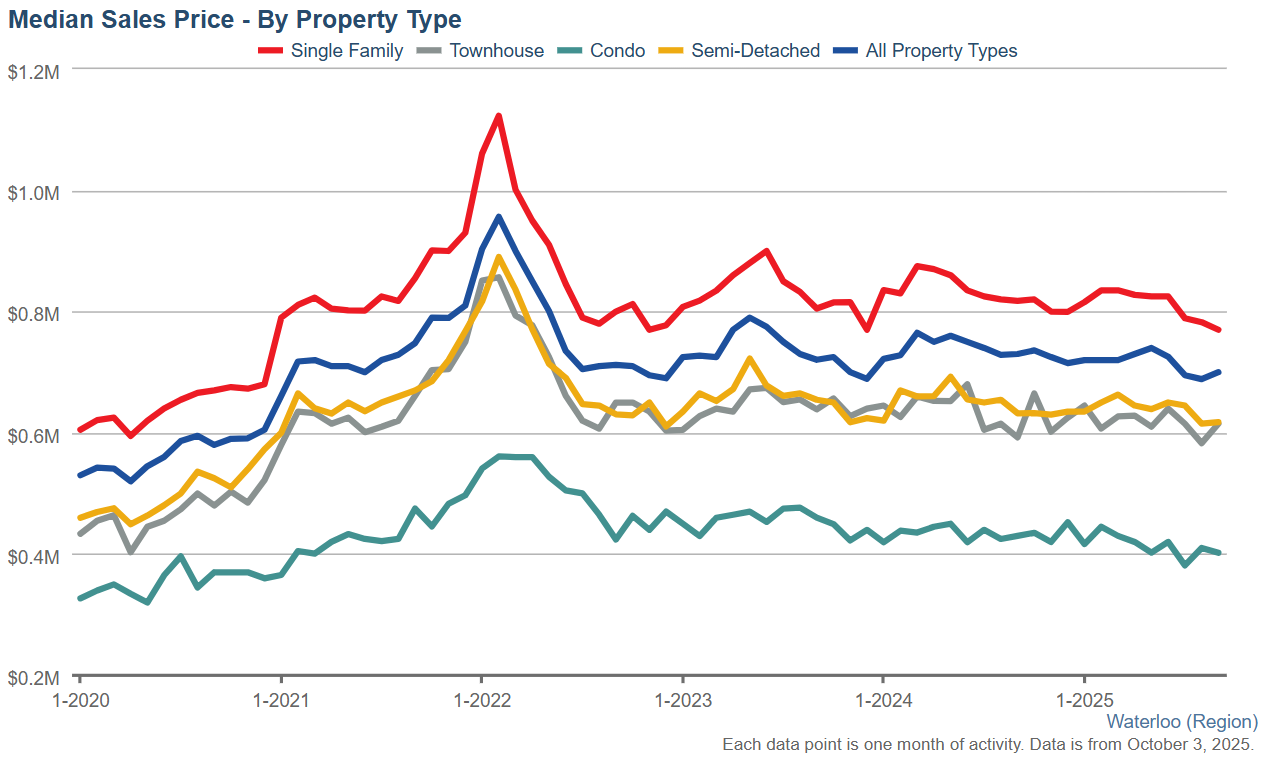
Monthly Median Sales Price – By Property Type
Monthly Average Sales Price – By Property Type
Monthly Average Days on Market
If you have any questions at all, are thinking of making a move this fall or are wondering what your home might be worth, give me a call or text to 519-497-4646 or shoot me an email to kevinbakerrealestate@gmail.com and we can sit down for a coffee and chat about your family’s needs going forward.
Have a great Thanksgiving next weekend with your families!
Kevin
Condo’s showing signs of a balanced market in Kitchener Waterloo
I hope you had a wonderful Canada Day! The weather lately has been great, a little hot for my liking but certainly a good reason to get outside and enjoy it.
The stats are out for June and things are looking more balanced in the Waterloo Region Real estate market. Let’s take a look…
In June, a total of 676 homes were sold. This represents a 0.3 per cent increase compared to the same period last year and a decline of 21.7 per cent compared to the average number of homes sold in the previous ten years for the same month.
While home sales in June were relatively stable year-over-year, we’re seeing a more balanced market emerge in Waterloo Region. What’s particularly notable is the increase in condominium sales – up over 34% – suggesting a lot of buyers are looking for more affordable housing options.. While more listings are coming to market, properties are taking a little longer to sell, giving buyers more time to make informed decisions during their home search.
Total residential sales in June included 442 detached homes (up 5.6 per cent from June 2024), and 113 townhouses (down 17.4 per cent). Sales also included 86 condominium units (up 34.4 per cent) and 35 semi-detached homes (down 25.4 per cent).
In June, the average sale price for all residential properties in Waterloo Region was $780,293. This represents a 1.1 per cent decrease compared to June 2024 and a 1.2 per cent decrease compared to May 2025.
- The average price of a detached home was $896,770. This represents a 0.2 per cent decrease from June 2024 and a decrease of 1.4 per cent compared to May 2025.
- The average sale price for a townhouse was $624,754. This represents a 6.0 percent decrease from June 2024 and a 1.6 percent decrease compared to May 2025.
- The average sale price for an apartment-style condominium was $435,435. This represents a 5.7 per cent decrease from June 2024 and an increase of 0.7 per cent compared to May 2025.
- The average sale price for a semi was $649,039, on par with June 2024 and a 0.5 per cent decrease compared to May 2025.
| MLS® Home Price Index Benchmark Price (HPI) | ||||||
| Kitchener-Waterloo | Cambridge | |||||
| Benchmark Type: | June 2025 | Monthly % Change | Yr./Yr. % Change | June 2025 | Monthly % Change | Yr./Yr. % Change |
| Composite | $686,100 | -2.3 | -7.5 | $723,400 | -1.5 | -4.2 |
| Single Family | $805,600 | -2.7 | -5.5 | $767,300 | -1.5 | -3.1 |
| Townhouse | $568,200 | -2.7 | -9.3 | $623,400 | -1.5 | -4.5 |
| Apartment | $417,900 | 1.5 | -8.3 | $458,200 | -0.8 | -6.6 |

There were 1,514 new listings added last month, an increase 5.3 per cent compared to June last year and a 15.1 percent increase compared to the previous ten-year average for June.
The average time to sell a home in June was 27 days, compared to 24 days in the previous month. In June 2024, it took 18 days for a home to sell, and the five-year average was 15 days.
If you have any questions at all, are thinking of making a move this summer or are wondering what your home might be worth, give me a call or text to 519-497-4646 or shoot me an email to kevinbakerrealestate@gmail.com and we can sit down for a coffee and chat about your family’s needs going forward.
Have a great rest of July!
Kevin
Condo market still very sluggish in May here in Waterloo, Kitchener and Cambridge
I hope you are having a great June so far. The nice weather is finally here and all the gardeners are loving it. The Real Estate Market here in Waterloo Region has been pretty sluggish over the past year and most notably this spring but I have noticed in the last week or two the showing activity has picked up on residential homes. The condo market is still saturated with inventory and not selling through well but prices seem to remain steady. Lets take a look at the stats for may….
In May, a total of 675 homes were sold, this represents a 9.3 per cent decrease compared to the same period last year and a decline of 26.2 per cent compared to the average number of homes sold in the previous ten years for the same month.
Total residential sales in May included 427 detached homes (down 8.4 per cent from May 2024), and 132 townhouses (down 1.5 per cent). Sales also included 67 condominium units (down 20.2 per cent) and 48 semi-detached homes (down 18.6 per cent).
In May, the average sale price for all residential properties in Waterloo Region was $789,154. This represents a 3.6 per cent decrease compared to May 2024 and a 0.8 per cent increase compared to April 2025.
- The average price of a detached home was $909,897. This represents a 3.7 percent decrease from May 2024 and a decrease of 1.0 per cent compared to April 2025.
- The average sale price for a townhouse was $634,320. This represents a 3.5 per cent decrease from May 2024 and an increase of 3.1 per cent compared to April 2025.
- The average sale price for an apartment-style condominium was $431,944. This represents a 6.7 percent decrease from May 2024 and a decrease of 9.4 per cent compared to April 2025.
- The average sale price for a semi was $652,627. This represents a decrease of 6.7 per cent compared to May 2024 and a decrease of 1.4 per cent compared to April 2025.
| MLS® Home Price Index Benchmark Price (HPI) | ||||||
| Kitchener-Waterloo | Cambridge | |||||
| Benchmark Type: | May 2025 | Monthly % Change | Yr./Yr. % Change | May 2025 | Monthly % Change | Yr./Yr. % Change |
| Composite | $702,400 | 0.6 | -6.6 | $734,300 | 1.0 | -3.4 |
| Single Family | $828,300 | 1.1 | -4.5 | $778,700 | 0.7 | -2.2 |
| Townhouse | $584,000 | -0.3 | -7.9 | $663,100 | 0.8 | -3.7 |
| Apartment | $411,600 | -6.7 | -10.2 | $462,100 | -2.0 | -6.8 |

Right now, we’re seeing a market that is different from the frenzied market of a few years ago, but that’s a good thing for buyers who have more breathing room to make decisions. The fundamentals that make Waterloo Region attractive – our diverse economy, strong tech sector, world-class educational institutes and stable governance – continue to strengthen. Waterloo Region has proven time and again that it is a solid place to invest and put down roots.
There were 1,663 new listings added last month, an increase 1.4 percent compared to May last year and a 15.6 percent increase compared to the previous ten-year average for May.
The average time to sell a home in May was 24 days, which was the same in the previous month. In May 2024, it took 16 days for a home to sell, and the five-year average was 14 days.
If you have any questions at all, are thinking of making a move this summer or are wondering what your home might be worth, give me a call or text to 519-497-4646 or shoot me an email to kevinbakerrealestate@gmail.com and we can sit down for a coffee and chat about your family’s needs going forward.
Have a great Fathers day next weekend to all the dads out there.
Kevin
Waterloo Regions Condo Market is shifting and has been for the past 8-12 months.
I hope you are having a great May so far. Looks like spring is hopefully here to stay, after this crazy winter and early spring weather we have been having. The numbers are out for Waterloo Region’s Real Estate market and we are certainly in a different environment than we have been used to for the past many years. Let’s break down the numbers and have a look….
In April, a total of 595 homes were sold in the Waterloo Region. This represents a 14.1 percent decrease compared to the same period last year and a decline of 26.7 percent compared to the average number of homes sold in the previous ten years for the same month.
Home sales in April showed typical seasonal improvement over March, but have remained notably below the ten-year average. What we’re seeing is a clear market rebalancing, with inventory levels up 75% above the ten-year average and nearly four months of supply across all property types. This shift is creating more opportunities for buyers who now have more time for due diligence and negotiations, while sellers are adapting to a market that demands strategic pricing and patience.
Total residential sales in April included 356 detached homes (down 12.5 per cent from April 2024), and 109 townhouses (down 19.9 per cent). Sales also included 71 condominium units (down 22.8 per cent) and 59 semi-detached homes (up 5.4 per cent).
In April, the average sale price for all residential properties in Waterloo Region was $789,639. This represents a 1.7 percent decrease compared to April 2024 and a 2.7 per cent increase compared to March 2025.
- The average price of a detached home was $927,591.?This represents a 1.7 percent decrease from April 2024 and an increase of 0.9 per cent compared to March 2025.
- The average sale price for a townhouse was $615,982. This represents a 7.0 percent decrease from April 2024 and a decrease of 0.2 per cent compared to March 2025.
- The average sale price for an apartment-style condominium was $473,079.?This is on par with April 2024 and an increase of 3.5 per cent compared to March 2025.
- The average sale price for a semi was $659,017. This represents a decrease of 0.7 per cent compared to April 2024 and a decrease of 0.6 per cent compared to March 2025.
Average Sale Price – Monthly

| MLS® Home Price Index Benchmark Price (HPI) | ||||||
| Kitchener-Waterloo | Cambridge | |||||
| Benchmark Type: | April 2025 | Monthly % Change | Yr./Yr. % Change | April 2025 | Monthly % Change | Yr./Yr. % Change |
| Composite | $703,500 | -3.5 | -6.1 | $730,400 | -1.4 | -3.4 |
| Single Family | $821,100 | -2.6 | -5.2 | $773,600 | -0.8 | -2.1 |
| Townhouse | $582,300 | -2.7 | -7.1 | $626,800 | -0.6 | -4.7 |
| Apartment | $441,200 | 1.6 | -3.2 | $471,800 | -2.3 | -6.4 |

There were 1,371 new listings added last month, a decrease of 4.9 percent compared to April last year and a 10.5 percent increase compared to the previous ten-year average for April.
The total number of homes available for sale in active status at the end of April was 1,936, an increase of 39.5 percent compared to April of last year and 75.3 percent above the previous ten-year average of 1,105 listings for April.
The total inventory across the market increased by 52.0 percent, resulting in a 3.8-month supply of all property types by the end of April. Condominium apartments had the highest inventory, with 8.0 months’ supply, followed by townhouses with 4.9 months’ supply and detached homes with 2.89 months’ supply. The number of months of inventory represents the time it would take to sell all current inventories at the current sales rate.
The average time to sell a home in April was 20 days, compared to 24 days in the previous month. In April 2024, it took 15 days for a home to sell, and the five-year average was 14 days.
Average Sales Price – Municipality

Average Sales Price – Township

Monthly Sales By Property Type

Monthly Supply of Homes for Sale

Monthly Supply of Homes for Sale – By Property Type

Monthly Median Sales Price – By Property Type

Monthly Average Sales Price – By Property Type

Monthly Average Days on Market

If you have any questions at all, are thinking of making a move this spring/summer or are wondering what your home might be worth, give me a call or text to 519-497-4646 or shoot me an email to kevinbakerrealestate@gmail.com and we can sit down for a coffee and chat about your family’s needs going forward.
Have a great Mother’s Day to all the mom’s out there.
Kevin
Condo Sales Cool as Inventory Reaches 9 Year high in Waterloo Region
I hope you are having a great April so far. Looks like the spring is hopefully here after that crazy weather we had on wednesday and that means an increase in activity in the Kitchener Waterloo Real Estate Market. Let’s take a look at the stats from March
In March, a total of 459 homes were sold in the Waterloo Region. This represents a 23.1 percent decrease compared to the same period last year and a decline of 45.2 percent compared to the average number of homes sold in the previous ten years for the same month.
March’s housing market shows a significant shift from last year’s dynamics, with sales activity cooling while inventory levels have reached their highest point for March since 2015. This changing landscape is providing buyers with more options and time to make informed decisions.
Total residential sales in March included 259 detached homes (down 24.7 percent from March 2024), and 98 townhouses (down 24.0 per cent). Sales also included 60 condominium units (down 29.4 per cent) and 40 semi-detached homes (up 8.1 per cent).
In March, the average sale price for all residential properties in Waterloo Region was $771,915. This represents a 4.4 per cent decrease compared to March 2024 and a 0.5 per cent increase compared to February 2025.
- The average price of a detached home was $921,985. This represents a 3.6 percent decrease from March 2024 and an increase of 2.3 per cent compared to February 2025.
- The average sale price for a townhouse was $622,231. This represents a 6.6 percent decrease from March 2024 and an increase of 1.2 per cent compared to February 2025.
- The average sale price for an apartment-style condominium was $457,925. This represents a 5.5 percent decrease from March 2024 and an increase of 4.8 per cent compared to February 2025.
- The average sale price for a semi was $663,145. This represents a decrease of 2.5 per cent compared to March 2024 and a decrease of 1.1 per cent compared to February 2025.
Average Sale Price – Monthly

| MLS® Home Price Index Benchmark Price (HPI) | ||||||
| Kitchener-Waterloo | Cambridge | |||||
| Benchmark Type: | March 2025 | Monthly % Change | Yr./Yr. % Change | March 2025 | Monthly % Change | Yr./Yr. % Change |
| Composite | $728,800 | -0.2 | -2.7 | $740,900 | -1.4 | -1.9 |
| Single Family | $843,300 | 0.3 | -2.5 | $779,500 | -1.6 | -1.3 |
| Townhouse | $598,300 | -0.3 | -3.4 | $630,600 | 0.2 | -3.2 |
| Apartment | $434,200 | -1.4 | -6.7 | $482,800 | -0.3 | -3.5 |

While both average prices and the HPI declined on a year-over-year basis, we’re seeing month-over-month price stability in most housing categories. The increased inventory, now at a 3.2-month supply, is creating a more balanced market environment compared to the tight conditions we’ve experienced over the past many years. This shift is particularly evident in the condominium segment, where we now have nearly seven months of inventory available.
There were 1,180 new listings added last month, an increase of 15.5 per cent compared to March last year and a 2.4 per cent decrease compared to the previous ten-year average for March.
The total number of homes available for sale in active status at the end of March was 1,700, an increase of 58.4 per cent compared to March of last year and 72.9 per cent above the previous ten-year average of 983 listings for March.
The total inventory across the market increased by 68.4 percent, resulting in a 3.2-month supply of all property types by the end of March. Condominium apartments had the highest inventory, with 6.9 months’ supply, followed by townhouses with 4.2 months’ supply and detached homes with 2.3 months’ supply. The number of months of inventory represents the time it would take to sell all current inventories at the current sales rate.
The average time to sell a home in March was 28 days, compared to 24 days in the previous month. In March 2024, it took 19 days for a home to sell, and the five-year average was 14 days.
Average Sales Price – Municipality

Average Sales Price – Township

Monthly Sales By Property Type

Monthly Supply of Homes for Sale

Monthly Supply of Homes for Sale – By Property Type

Monthly Median Sales Price – By Property Type

Monthly Average Sales Price – By Property Type

Monthly Average Days on Market

If you have any questions at all, are thinking of making a move this spring or are wondering what your home might be worth, give me a call or text to 519-497-4646 or shoot me an email to kevinbakerrealestate@gmail.com and we can sit down for a coffee and chat about your family’s needs going forward.
Have a great rest of your weekend!
Kevin
New listings up, sales down but prices remain stable in Kitchener Waterloo and Cambridge
I hope you are having a great March so far. Looks like the spring thaw is fast approaching and that means an increase in activity in the Kitchener Waterloo Real Estate Market. Let’s take a look at the stats from February….
In February, a total of 363 homes were sold. This represents a 26.1 percent decrease compared to the same period last year and a decline of 38.8 percent compared to the average number of homes sold in the previous ten years for the same month.
While February’s home sales were affected by concerns over tariffs and their potential impact on employment, the market showed some encouraging signs. We saw a steady increase in new listings while prices remained stable. The month’s significant snowfall created practical challenges for buyers and sellers, affecting property viewings and transactions. However, I am seeing positive indicators in the market, with consistent attendance at open houses, pre-listing appointments, steady mortgage pre-approvals, and buyers on the sidelines carefully watching for the right opportunity to make their move.
Total residential sales in February included 221 detached homes (down 21.9 percent from February 2024), and 71 townhouses (down 36.0 percent). Sales also included 47 condominium units (down 35.6 percent) and 23 semi-detached homes (down 4.2 percent).
In February, the average sale price for all residential properties in Waterloo Region was $767,800. This represents a 1.3 percent increase compared to February 2024 and a 1.8 per cent increase compared to January 2025.
- The average price of a detached home was $900,003. This represents a 1.0 per cent increase from February 2024 and an increase of 2.1 per cent compared to January 2025.
- The average sale price for a townhouse was $613,924. This represents a 2.7 percent decrease from February 2024 and a decrease of 2.6 per cent compared to January 2025.
- The average sale price for an apartment-style condominium was $437,000. This represents a 5.8 percent decrease from February 2024 and a decrease of 7.2 per cent compared to January 2025.
- The average sale price for a semi was $670,352. This represents a decrease of 0.5 percent compared to February 2024 and an increase of 6.6 percent compared to January 2025.
Average Sale Price – Monthly

| MLS® Home Price Index Benchmark Price | ||||||
| Kitchener-Waterloo | Cambridge | |||||
| Benchmark Type: | February 2025 | Monthly % Change | Yr./Yr. % Change | February 2025 | Monthly % Change | Yr./Yr. % Change |
| Composite | $729,900 | 0.0 | -0.9 | $751,300 | 0.6 | 0.6 |
| Single Family | $841,000 | -0.8 | -1.1 | $792,100 | 0.6 | 1.6 |
| Townhouse | $600,200 | 1.7 | -1.8 | $629,300 | 0.5 | -2.1 |
| Apartment | $440,400 | 2.3 | -1.9 | $484,500 | 1.1 | -2.2 |

As we navigate these shifting dynamics in the Waterloo Region housing market, it’s important to remember that while sales may be down, the increase in inventory reflects growing opportunities for buyers. Now is a great time for buyers to get out and start looking for a new home.
There were 858 new listings added last month, an increase of 7.3 percent compared to February last year and a 0.8 percent increase compared to the previous ten-year average for February.
The total number of homes available for sale in active status at the end of February was 1,450, an increase of 55.7 percent compared to February of last year and 68.7 percent above the previous ten-year average of 860 listings for February.
The total inventory across the market increased by 52.9 percent, resulting in a 2.6-month supply of all property types by the end of February. Condominium apartments had the highest inventory, with 5.9 months’ supply, followed by townhouses with 3.6 months’ supply and detached homes with 1.8 months’ supply. The number of months of inventory represents the time it would take to sell off current inventories at the current sales rate.
The average time to sell a home in February was 24 days, compared to 34 days in the previous month. Likewise, in February 2024, it took 24 days for a home to sell, and the five-year average was 15 days.
If you have any questions at all, are thinking of making a move this spring or are wondering what your home might be worth, give me a call or text to 519-497-4646 or shoot me an email to kevinbakerrealestate@gmail.com and we can sit down for a coffee and chat about your family’s needs going forward.
Have a great rest of your week!
Kevin
Average Sales Price – Municipality

Average Sales Price – Township

Monthly Sales By Property Type

Monthly Supply of Homes for Sale

Monthly Supply of Homes for Sale – By Property Type

Monthly Median Sales Price – By Property Type

Monthly Average Sales Price – By Property Type

Monthly Average Days on Market

Waterloo Region Condo Market Update for January 2025
I hope you are having a great winter so far. The weather sure has been cold so hopefully you have been able to get out and enjoy some skiing or even a trip down south to enjoy some warmer weather.
The stats are out for January and things are remaining steady in the Waterloo Region Real Estate market. Listings are up, sales and prices are down slightly, so that is giving the buyers who are out there plenty of choice when looking for their next home. Let’s take a look at the numbers…
In January, a total of 329 homes were sold in the Waterloo Region. This represents a 12.0 per cent decrease compared to the same period last year and a decline of 18.6 per cent compared to the average number of homes sold in the previous ten years for the same month.
The Waterloo Region’s housing market shows promising dynamics as we begin 2025. With nearly 50 percent more active listings compared to last January and inventory levels well above the ten-year average, we’re seeing more choices for buyers in the market. While sales have softened compared to last year, the increased inventory levels are creating more balanced conditions between buyers and sellers.
Total residential sales in January included 188 detached homes (down 10.5 per cent from January 2024), and 81 townhouses (down 8.0 per cent). Sales also included 39 condominium units (down 30.4 per cent) and 21 semi-detached homes (up 5.0 per cent).
In January, the average sale price for all residential properties in Waterloo Region was $755,859. This represents a 1.0 per cent decrease compared to January 2024 and a 0.6 per cent decrease compared to December 2024.
- The average price of a detached home was $882,941. This represents a 3.1 per cent decrease from January 2024 and a decrease of 1.2 per cent compared to December 2024.
- The average sale price for a townhouse was $630,116. This represents a 1.1 per cent decrease from January 2024 and an increase of 0.1 per cent compared to December 2024.
- The average sale price for an apartment-style condominium was $469,623. This represents a 4.6 per cent increase from January 2024 and a decrease of 1.2 per cent compared to December 2024.
- The average sale price for a semi was $634,762. This represents a decrease of 1.9 per cent compared to January 2024 and a decrease of 1.6 per cent compared to December 2024.
Average Sale Price – Monthly

| MLS® Home Price Index Benchmark Price | ||||||
| Kitchener-Waterloo | Cambridge | |||||
| Benchmark Type: | January 2025 | Monthly % Change | Yr./Yr. % Change | January 2025 | Monthly % Change | Yr./Yr. % Change |
| Composite | $730,000 | 1.8 | 0.6 | $747,300 | 3.1 | 0.0 |
| Single Family | $847,500 | 3.1 | 1.5 | $787,400 | 3.8 | 1.2 |
| Townhouse | $590,100 | -1.5 | -2.0 | $626,400 | -0.6 | -3.9 |
| Apartment | $430,600 | -3.4 | -4.2 | $479,600 | 0.2 | -2.3 |

In an expected move, the Bank of Canada lowered its policy rate by 25 basis points to 3 per cent on January 29, 2025, helping to bring down the cost of borrowing. This reduction was welcome news for potential homebuyers, however, with a potential trade war with the U.S. still looming, it’s difficult to predict what will happen when the Bank makes its next interest rate announcement on March 12.
While the current economic uncertainty might make some house hunters hesitant, with the new mortgage reforms that took effect in December. These changes make it easier to qualify for a mortgage with a down payment of less than 20 percent. Additionally, the insured mortgage cap increased from $1 million to $1.5 million, and all first-time buyers and those purchasing new builds will be eligible for 30-year amortizations, which will help reduce monthly payments.
There were 901 new listings added in Waterloo Region last month, an increase of 25.0 per cent compared to January last year and a 27.6 per cent increase compared to the previous ten-year average for January.
The total number of homes available for sale in active status at the end of January was 1,296 an increase of 49.5 per cent compared to January of last year and 71.5 per cent above the previous ten-year average of 992 listings for January.
The total inventory across the market increased by 43.8 percent, resulting in a 2.3-month supply of all property types by the end of January. Condominium apartments had the highest inventory, with 5.1 months’ supply, followed by townhouses with 3.5 months’ supply and detached homes with 1.5 months’ supply. The number of months of inventory represents the time it would take to sell off current inventories at the current sales rate.
The average time to sell a home in January was 33 days, compared to 37 days in the previous month. In January 2024, it took 32 days for a home to sell, and the five-year average was 21 days.
If you have any questions at all, are thinking of making a move this spring or are wondering what your home might be worth, give me a call or text to 519-497-4646 or shoot me an email to kevinbakerrealestate@gmail.com and we can sit down for a coffee and chat about your family’s needs going forward.
Have a great rest of your week!
Kevin
Average Sales Price – Municipality

Average Sales Price – Township

Monthly Sales By Property Type

Monthly Supply of Homes for Sale

Monthly Supply of Homes for Sale – By Property Type

Monthly Median Sales Price – By Property Type

Monthly Average Sales Price – By Property Type

Monthly Average Days on Market

Kitchener Waterloo and Cambridge show slight increase in home sales in 2024
Happy New Year! I hope you had a wonderful holiday season with your families and 2025 is off to a great start! With the arrival of snow, it looks like winter is finally here.
The stats are out for 2024 and it was a decent year for real estate sales here in Waterloo Region.
There were 6,777 homes sold in 2024, an increase of 2.8 per cent compared to 2023, and a decline of 18.9 per cent compared to the previous 5-year average for annual sales.
On a monthly basis, 334 homes were sold in December, an increase of 14.4 per cent compared to December 2023 and 9.9 per cent below the previous 5-year average for the month.
Although the number of homes sold in 2024 was still well below long-term averages, the final three months of the year showed a significant increase in sales. This increase coincided with lower interest rates, which heightened buyer interest and activity in the market.
For 2024, total residential sales included 4,100 detached (up 5.5 per cent), and 1,368 townhouses (up 2.6 per cent). Sales also included 821 condominium units (down 8.8 per cent) and 477 semi-detached homes (up 5.5 per cent).
In December, the average sale price for all residential properties in Waterloo Region was $763,840. This represents a 3.3 per cent increase compared to December 2023 and a 1.4 per cent increase compared to November 2024.
- The average price of a detached home was $898,204. This represents a 6.0 per cent increase from December 2023 and an increase of 4.0 per cent compared to November 2024.
- The average sale price for a townhouse was $630,676. This represents a 1.7 per cent increase from December 2023 and an increase of 2.7 per cent compared to November 2024.
- The average sale price for an apartment-style condominium was $475,006. This represents a 3.7 per cent decrease from December 2023 and an increase of 5.5 per cent compared to November 2024.
- The average sale price for a semi was $644,786. This represents an increase of 5.1 per cent compared to December 2023 and an increase of 0.2 per cent compared to November 2024.
Average Sale Price – Monthly

Year-to-date, the average sale price for all residential properties in Waterloo Region decreased 0.3 per cent to $784,343 compared to 2023.
- The year-to-date average price of a detached home was $910,901. This represents a 0.8 per cent decrease compared to 2023.
- The year-to-date average sale price for a townhouse was $638,385. This represents a 2.3 per cent decrease compared to 2023.
- The year-to-date average sale price for an apartment-style condominium was $472,801. This represents a 2.0 per cent decrease compared to 2023.
- The year-to-date average sale price for a semi was $662,859. This represents a decrease of 2.1 per cent compared to 2023.
Average Sale Price – Year-to-date

| Monthly MLS® Home Price Index Benchmark Price | ||||||
| Kitchener-Waterloo | Cambridge | |||||
| Benchmark Type: | December 2024 | Monthly % Change | Yr./Yr. % Change | December 2024 | Monthly % Change | Yr./Yr. % Change |
| Composite | $717,200 | -0.4 | 0.6 | $725,000 | -1.7 | 2.4 |
| Single Family | $822,100 | -0.8 | 1.9 | $758,700 | -2.1 | 4.1 |
| Townhouse | $599,000 | 1.1 | -1.7 | $630,300 | 0.6 | -3.7 |
| Apartment | $445,600 | 0.3 | -5.5 | $478,600 | -0.2 | -4.0 |
| Annual MLS® Home Price Index Benchmark Price | ||||
| Kitchener-Waterloo | Cambridge | |||
| Benchmark Type: | 2024 | Yr./Yr. % Change | 2024 | Yr./Yr. % Change |
| Composite | $734,500 | -2.6 | $747,000 | -1.0 |
| Single Family | $846,500 | -1.3 | $781,900 | -0.5 |
| Townhouse | $612,900 | -2.9 | $646,600 | -0.9 |
| Apartment | $451,200 | -5.1 | $491,000 | 0.8 |

With the introduction of 30-year amortization options for all first-time homebuyers and new construction purchases now in effect as of December 15, 2024, along with an increased cap for insured mortgages now set at $1.5 million, we are optimistic that the housing market will become more accessible for aspiring homeowners in 2025
There were 346 new listings added last month, an increase 19.7 per cent compared to December of last year and a 1.6 per cent increase compared to the previous ten-year average for December.
In 2024, 13,176 new listings were added, an increase of 14.9 per cent compared to 2023, and a 10.8 per cent increase compared to the previous ten-year annual average.
The total number of homes available for sale in active status at the end of December was 1,092, an increase of 39.5 per cent compared to December of last year and 66.6 per cent above the previous ten-year average of 656 listings for December.
The number of months of inventory across the residential market is up 35.7 per cent compared to December of last year, now at 1.9 months. December’s rolling 12-month average was 2.6 months, which has risen from the 1.67 average of the past decade. In December, condominium apartments had the highest inventory, with 4.5 months’ supply, followed by townhouses with 2.7 months’ supply and detached homes with 1.3 months’ supply. The number of months of inventory represents the time it would take to sell off current inventories at the current sales rate
The average number of days to sell in December was 36, compared to 31 days in December 2023. The previous 5-year average is 23 days.
The average days to sell in 2024 was 23 days, compared to 19 days in 2023 and a previous 5-year average of 17 days.
If you have any questions at all, are thinking of making a move this winter, or are wondering what your home might be worth, give me a call or text to 519-497-4646 or shoot me an email to kevinbakerrealestate@gmail.com and we can sit down for a coffee and chat about your family’s needs going forward.
Have a great rest of your week!
Kevin
Average Sales Price – Municipality

Average Sales Price – Township

Monthly Sales By Property Type

Monthly Supply of Homes for Sale

Monthly Supply of Homes for Sale – By Property Type

Monthly Median Sales Price – By Property Type

Monthly Average Sales Price – By Property Type

Monthly Average Days on Market

Home Sales Up in Kitchener Waterloo and Cambridge
I hope you had a great Halloween weekend with the kids!! The weather was pretty good this year and I heard from many friends that they had well in excess of 100 kids with the top one being 400!! That’s crazy.
Well November is here and the stats are out for the October Waterloo Region Real Estate market. Sales were up and prices were up slightly which is a great sign that the market is starting to turn around. With the recent rate drops that is starting to get buyers off the sidelines. Let’s take a look at the stats.
In October, a total of 604 homes were sold in the Waterloo Region. This represents a 7.1 per cent increase compared to the same period last year and a decline of 14.2 per cent compared to the average number of homes sold in the previous ten years for the same month.
For the first time since May, we witnessed an encouraging rise in home sales throughout Waterloo Region last month. This positive trend reflects a shift toward more balanced conditions within our housing market and a renewed confidence among buyers.
Total residential sales in October included 383 detached homes (up 15.4 per cent from October 2023), and 104 townhouses (down 20.0 per cent). Sales also included 66 condominium units (up 1.5 per cent) and 49 semi-detached homes (up 53.1 per cent).
In October, the average sale price for all residential properties in Waterloo Region was $779,008. This represents a 1.4 per cent increase compared to October 2023 and a 1.4 per cent decrease compared to September 2024.
- The average price of a detached home was $885,587. This represents a 0.6 per cent decrease from October 2023 and a decrease of 2.9 per cent compared to September 2024.
- The average sale price for a townhouse was $643,382. This represents a 0.2 per cent decrease from October 2023 and an increase of 7.8 per cent compared to September 2024.
- The average sale price for an apartment-style condominium was $484,429. This represents a 1.8 per cent increase from October 2023 and a decrease of 0.2 per cent compared to September 2024.
- The average sale price for a semi was $650,098. This represents a decrease of 1.2 per cent compared to October 2023 and a decrease of 0.7 per cent compared to September 2024.
Average Sale Price – Monthly

| MLS® Home Price Index Benchmark Price | ||||||
| Kitchener-Waterloo | Cambridge | |||||
| Benchmark Type: | October 2024 | Monthly % Change | Yr./Yr. % Change | October 2024 | Monthly % Change | Yr./Yr. % Change |
| Composite | $713,800 | -2.1 | -2.5 | $738,400 | -0.5 | -1.8 |
| Single Family | $821,900 | -2.7 | -1.1 | $775,900 | -0.2 | -0.6 |
| Townhouse | $594,500 | -1.4 | -5.8 | $628,500 | -2.0 | -5.9 |
| Apartment | $439,500 | 0.9 | -5.7 | $480,400 | -0.2 | -4.3 |

On Wednesday, October 23, the Bank of Canada cut its policy rate by 50 basis points to 3.75 per cent. This marks the fourth consecutive rate cut since June and is the most substantial decrease since March 2020. The interest rate cuts are certainly beneficial for those with variable mortgages and encouraging news for homeowners facing mortgage renewals.
There were 1,144 new listings added in Waterloo Region last month, an increase of 0.3 per cent compared to October last year and a 19.9 per cent increase compared to the previous ten-year average for October.
The total number of homes available for sale in active status at the end of October was 1,711 an increase of 21.0 per cent compared to October of last year and 48.5 per cent above the previous ten-year average of 1,153 listings for October.
The total inventory across the market increased by 19.2 percent, resulting in a 3.1-month supply of all property types by the end of October. Condominium apartments had the highest inventory, with 5.5 months’ supply, followed by townhouses with 3.8 months’ supply and detached homes with 2.5 months’ supply. The number of months of inventory represents the time it would take to sell off current inventories at the current sales rate.
The average time to sell a home in October was 27 days, one day shorter than the previous month. In October 2023, it took 21 days for a home to sell, and the five-year average is 18 days.
If you have any questions at all, are thinking of making a move this winter, or are wondering what your home might be worth, give me a call or text to 519-497-4646 or shoot me an email to kevinbakerrealestate@gmail.com and we can sit down for a coffee and chat about your family’s needs going forward.
Have a great week!
Kevin
Average Sales Price – Municipality

Average Sales Price – Township

Monthly Sales By Property Type

Monthly Supply of Homes for Sale

Monthly Supply of Homes for Sale – By Property Type

Monthly Median Sales Price – By Property Type
Monthly Average Sales Price – By Property Type

Monthly Average Days on Market

Waterloo Region Condo Sales see’s a Decrease in September
I hope you had a great week and are looking forward to the weekend. The weather has been so nice in September but I am sure fall is just around the corner. The stats are out for September in the Waterloo Region Housing market and Sales were down once again but prices were up slightly. Let’s take a look at the numbers…
In September, a total of 521 homes were sold in the Waterloo Region. This represents a decrease of 2.1 per cent compared to the same period last year and a decline of 23.5 per cent compared to the average number of homes sold in the previous ten years for the same month.
There has been an overall slowdown in home sales, but we continued to see strong demand for detached homes, resulting in an increase in sales for that specific type of property last month. The buyers have a bit more selection than a year ago as inventory is up, and homes take a little longer to sell. This can mean a less stressful homebuying experience, but for sellers, the current market may require more patience or even adjustment in price expectation.
Total residential sales in September included 336 detached homes (up 9.4 per cent from September 2023), and 95 townhouses (down 22.1 per cent). Sales also included 57 condominium units (down 16.2 per cent) and 32 semi-detached homes (down 3.0 per cent).
In September, the average sale price for all residential properties in Waterloo Region was $788,944. This represents a 2.9 per cent increase compared to September 2023 and a 2.3 per cent increase compared to August 2024.
- The average price of a detached home was $910,286. This represents a 2.3 per cent increase from September 2023 and an increase of 2.2 per cent compared to August 2024.
- The average sale price for a townhouse was $595,435. This represents a 6.9 per cent decrease from September 2023 and a decrease of 2.7 per cent compared to August 2024.
- The average sale price for an apartment-style condominium was $483,331. This represents a decrease of 3.4 per cent from September 2023 and an increase of 4.9 per cent compared to August 2024.
- The average sale price for a semi was $654,613. This represents a decrease of 2.9 per cent compared to September 2023 and an increase of 0.1 per cent compared to August 2024.
Average Sale Price – Monthly

| MLS® Home Price Index Benchmark Price | ||||||
| Kitchener-Waterloo | Cambridge | |||||
| Benchmark Type: | September 2024 | Monthly % Change | Yr./Yr. % Change | September 2024 | Monthly % Change | Yr./Yr. % Change |
| Composite | $728,700 | 0.2 | -1.8 | $741,800 | -0.1 | 0.0 |
| Single Family | $844,400 | 0.6 | 0.3 | $777,500 | 0.2 | 1.3 |
| Townhouse | $602,800 | -0.7 | -5.5 | $641,700 | -1.7 | -4.8 |
| Apartment | $435,700 | -1.3 | -8.3 | $481,500 | -0.2 | -4.2 |

In September, the federal government made some policy changes. These changes include extending mortgage terms to 30 years for first-time homebuyers and all buyers of new builds and raising the CMHC insurance cap from $1 million to $1.5 million. These changes will come into effect later this year. Combined with anticipated further interest rate cuts, these adjustments could enable more buyers to purchase their first home.
There were 1,313 new listings added last month, a decrease of 6.5 per cent compared to September last year and a 20.0 per cent increase compared to the previous ten-year average for September.
The total number of homes available for sale in active status at the end of September was 1,751 an increase of 21.3 per cent compared to September of last year and 42.2 per cent above the previous ten-year average of 1,232 listings for September.
The total inventory across the market increased by 23.1 percent, resulting in a 3.2-month supply of all property types by the end of September. Condominium apartments had the highest inventory, with 5.5 months’ supply, followed by townhouses with 3.6 months’ supply and detached homes with 2.7 months’ supply. The number of months of inventory represents the time it would take to sell off current inventories at the current sales rate.
The average time it took to sell a home in September was 28 days, which is three days longer than the previous month. In September 2023, it took 19 days for a home to sell, and the five-year average is 18 days.
If you have any questions at all, are thinking of making a move this fall and wondering what your home might be worth, give me a call or text to 519-497-4646 or shoot me an email to kevinbakerrealestate@gmail.com and we can sit down for a coffee and chat about your family’s needs going forward.
Enjoy your Thanksgiving with your families next weekend!
Kevin
Average Sales Price – Municipality

Average Sales Price – Township

Monthly Sales By Property Type

Monthly Supply of Homes for Sale

Monthly Supply of Homes for Sale – By Property Type

Monthly Median Sales Price – By Property Type

Monthly Average Sales Price – By Property Type

Monthly Average Days on Market

Condo Sales Soft as Inventory levels grow
I hope you had a great Labour day weekend and with all the kids back to school, life is getting back to routine again. The fall market will be here soon enough and with that the colder weather again.
The stats are out for August and a total of 539 homes were sold in the Waterloo Region. This represents a decrease of 5.3 per cent compared to the same period last year and a decline of 24.1 per cent compared to the average number of homes sold in the previous ten years for the same month.
Despite a cooling market, detached homes continue to see strong demand, reflected in a 6.0 percent increase in sales year-over-year. With home prices showing stability in recent months and interest rates decreasing, we saw some home buyers finally come out from the wings to take advantage of the summer slowdown to seek out specific property types, like single-family homes.
Total residential sales in August included 335 detached homes (up 6.0 per cent from August 2023), and 103 townhouses (down 22.6 per cent). Sales also included 60 condominium units (down 18.9 per cent) and 40 semi-detached homes (down 11.1 per cent).
In August, the average sale price for all residential properties in Waterloo Region was $769,203. This represents a 1.1 per cent increase compared to August 2023 and a 1.7 per cent decrease compared to July 2024.
- The average price of a detached home was $889,085. This represents a 0.8 per cent increase from August 2023 and a decrease of 2.7 per cent compared to July 2024.
- The average sale price for a townhouse was $611,164. This represents a 7.5 per cent decrease from August 2023 and a decrease of 1.5 per cent compared to July 2024.
- The average sale price for an apartment-style condominium was $457,075. This represents a decrease of 5.8 per cent from August 2023 and a decrease of 7.7 per cent compared to July 2024.
- The average sale price for a semi was $654,070. This represents a decrease of 2.8 per cent compared to August 2023 and a decrease of 1.9 per cent compared to July 2024.
Average Sale Price – Monthly

| MLS® Home Price Index Benchmark Price | ||||||
| Kitchener-Waterloo | Cambridge | |||||
| Benchmark Type: | August 2024 | Monthly % Change | Yr./Yr. % Change | August 2024 | Monthly % Change | Yr./Yr. % Change |
| Composite | $727,200 | -0.5 | -3.3 | $742,500 | -0.1 | -2.1 |
| Detached | $839,300 | 0.0 | -1.9 | $776,300 | -0.1 | -1.6 |
| Townhouse | $606,800 | -1.8 | -5.6 | $652,800 | 0.3 | -1.9 |
| Apartment | $441,300 | -3.0 | -7.1 | $482,600 | -2.7 | -4.2 |

While we’re seeing increased inventory and longer days on the market, this trend might not last if the Bank of Canada continues to lower interest rates. Buyers will need to weigh the benefits of potentially lower rates against the possibility of rising prices as demand picks up.
There were 988 new listings added last month, a decrease of 4.2 per cent compared to August last year and a 7.3 per cent increase compared to the previous ten-year average for August.
The total number of homes available for sale in active status at the end of August was 1,640 an increase of 49.2 per cent compared to August of last year and 40.1 per cent above the previous ten-year average of 1,308 listings for August.
The total inventory across the market increased by 50.0 percent, resulting in a 3.0-month supply of all property types by the end of August. Condominium apartments had the highest inventory, with 5.3 months’ supply, followed by townhouses with 3.5 months’ supply and detached homes with 2.5 months’ supply. The number of months of inventory represents the time it would take to sell off current inventories at the current sales rate.
The average time it took to sell a home in August was 25 days, which is three days longer than the previous month. In August 2023, it took 19 days for a home to sell, and the five-year average is 19 days.
If you have any questions at all, are thinking of making a move this fall and wondering what your home might be worth, give me a call or text to 519-497-4646 or shoot me an email to kevinbakerrealestate@gmail.com and we can sit down for a coffee and chat about your family’s needs going forward.
Enjoy the rest of your September!
Kevin
Average Sales Price – Municipality

Average Sales Price – Township

Monthly Sales By Property Type

Monthly Supply of Homes for Sale

Monthly Supply of Homes for Sale – By Property Type

Monthly Median Sales Price – By Property Type

Monthly Average Sales Price – By Property Type

Monthly Average Days on Market

Waterloo Region Condo Market cooling with increased inventory and fewer buyers
I hope you are having a great start to summer and enjoyed the Canada Day Long weekend. I know the golfers have had some mixed weather but for the most part the grass is still nice and green.
The stats are out for June and we have seen some cooling in the real estate market here in Waterloo Region. Listing inventory is growing and it seems that the buyers are staying on the sidelines waiting for rates to come down a little more. Let’s dive into the stats to take a look…
In June, a total of 674 homes were sold, which represents a decrease of 13.7 per cent compared to the same period last year and a decline of 24.8 per cent compared to the average number of homes sold in the previous ten years for the same month.
Total residential sales in June included 424 detached (down 9.6 per cent from June 2023), and 136 townhouses (down 8.7 per cent). Sales also included 66 condominium units (down 44.5 per cent) and 47 semi-detached homes (up 14.6 per cent).
In June, the average sale price for all residential properties in Waterloo Region was $790,945. This represents a 5.8 per cent decrease compared to June 2023 and a 3.3 per cent decrease compared to May 2024.
- The average price of a detached home was $900,307. This represents a 10.3 per cent decrease from June 2023 and a decrease of 4.6 per cent compared to May 2024.
- The average sale price for a townhouse was $663,642. This represents a 0.6 per cent decrease from June 2023 and an increase of 2.0 per cent compared to May 2024.
- The average sale price for an apartment-style condominium was $462,145. This represents a decrease of 1.8 per cent from June 2023 and an increase of 0.5 per cent compared to May 2024.
- The average sale price for a semi was $649,353. This represents a decrease of 6.7 per cent compared to June 2023 and a decrease of 7.2 per cent compared to May 2024.
Average Sale Price – Monthly

| MLS® Home Price Index Benchmark Price | ||||||
| Kitchener-Waterloo | Cambridge | |||||
| Benchmark Type: | June 2024 | Monthly % Change | Yr./Yr. % Change | June 2024 | Monthly % Change | Yr./Yr. % Change |
| Composite | $741,500 | -1.4 | -5.6 | $755,200 | -0.7 | -3.1 |
| Detached | $852,900 | -1.6 | -5.1 | $791,900 | -0.6 | -3.1 |
| Townhouse | $626,400 | -1.2 | -3.9 | $652,600 | -0.7 | -0.6 |
| Apartment | $455,800 | -0.5 | -4.7 | $490,600 | -1.1 | 1.6 |

The average selling price for residential properties has decreased by 5.8 per cent since June 2023, with detached homes showing the most significant drop at 10.3 percent. This indicates a broader softness in the market and a shifting from a Sellers market to a more balanced market at the moment. The silver lining is this presents a more favourable pricing environment for buyers, with more choices, greater flexibility, and the potential to negotiate better deals.
There were 1,431 new listings added last month, an increase of 7.6 per cent compared to June last year and a 10.6 per cent increase compared to the previous ten-year average for June.
The total number of homes available for sale in active status at the end of June was 1,790, an increase of 75.5 per cent compared to June of last year and 31.9 per cent above the previous ten-year average of 1,357 listings for June.
Market-wide inventory levels were up 73.7 per cent, with 3.3 months’ supply for all property types at the end of June. The property type that gained the most inventory was the condo apartment segment, which increased by 103.1 percent. That amounts to 6.5 months’ supply for condo apartments, 2.8 months for detached homes, and 3.2 months for townhouses. The number of months of inventory represents the amount of time it would take to sell off current inventories at the current sales rate.
The average number of days to sell in June was 18, compared to 15 days in June 2023. The previous 5-year average is 15 days.
If you have any questions at all, are thinking of making a move this summer and wondering what your home might be worth, give me a call or text to 519-497-4646 and we can sit down for a coffee and chat about your family’s needs going forward.
Enjoy the rest of your July!
Kevin
Average Sales Price – Municipality

Average Sales Price – Township

Monthly Sales By Property Type

Monthly Supply of Homes for Sale

Monthly Supply of Homes for Sale – By Property Type

Monthly Median Sales Price – By Property Type

Monthly Average Sales Price – By Property Type

Monthly Average Days on Market

Condo Market Sales Very Sluggish for May in Kitchener Waterloo and Cambridge
I hope you are having a great start to June. My apologies for sending this out later than usual but I just got back from a week out on the east coast. My youngest son got married in Moncton on June 1st. The wedding couple looked beautiful and everyone that attended seemed to have a great time.
We also got news last week that rates have come down slightly. The Bank of Canada dropped the key overnight lending rate ¼ point to 4.75%. I don’t see a huge impact on the market just yet but it’s a good start to helping Canadians get into more affordable housing.
The stats are out for May in the Waterloo Region Real Estate market. The market showed signs of sluggishness mainly due to the condo market. Single detached sales were down slightly while the condo market was down quite substantially as a whole. Inventory levels have risen sharply which is giving buyers much more to choose from when they are looking to buy their next home. Let’s take a look at the numbers.
In May, a total of 742 homes were sold in Waterloo Region. This represents a decrease of 8.1 per cent compared to the same period last year and a decline of 20.0 per cent compared to the average number of homes sold in the previous ten years for the same month.
We saw a dip in the number of sales across all categories in May, with condo apartments experiencing the largest drop. The Condo market also had the greatest supply level, posing a challenge for sellers, especially for units with one or fewer bedrooms, where the current inventory level exceeds buyer demand.
Total residential sales in May included 467 detached (down 1.3 per cent from May 2023), and 134 townhouses (down 3.6 per cent). Sales also included 82 condominium units (down 34.4 per cent) and 59 semi-detached homes (down 13.2 per cent).
In May, the average sale price for all residential properties in Waterloo Region was $818,507. This represents a 0.3 per cent decrease compared to May 2023 and a 2.3 per cent increase compared to April 2024.
- The average price of a detached home was $943,859. This represents a 1.9 per cent decrease from May 2023 and an increase of 0.4 per cent compared to April 2024.
- The average sale price for a townhouse was $653,761. This represents a 6.1 per cent decrease from May 2023 and a decrease of 0.9 per cent compared to April 2024.
- The average sale price for an apartment-style condominium was $459,260. This represents a decrease of 5.6 per cent from May 2023 and a decrease of 5.6 per cent compared to April 2024.
- The average sale price for a semi was $699,780. This represents a decrease of 3.9 per cent compared to May 2023 and an increase of 5.1 per cent compared to April 2024.
Average Sale Price – Monthly

| MLS® Home Price Index Benchmark Price | ||||||
| Kitchener-Waterloo | Cambridge | |||||
| Benchmark Type: | May 2024 | Monthly % Change | Yr./Yr. % Change | May 2024 | Monthly % Change | Yr./Yr. % Change |
| Composite | $752,100 | 0.3 | -4.2 | $760,300 | 0.5 | -4.0 |
| Detached | $866,900 | 0.1 | -3.4 | $796,400 | 0.8 | -4.3 |
| Townhouse | $634,100 | 1.2 | -1.0 | $657,300 | -0.1 | 1.4 |
| Apartment | $458,200 | 0.6 | -6.0 | $495,900 | -1.6 | 2.8 |

This spring, we are witnessing a significant increase in the availability of apartment-style condos, with a record high number of units on the market. At the same time, we are observing a shift in demand away from smaller-sized condo units, potentially influenced by the higher interest rates impacting investor market activity for this property type.
There were 1,644 new listings added last month, an increase of 28.9 per cent compared to May last year and a 15.8 per cent increase compared to the previous ten-year average for May.
The total number of homes available for sale in active status at the end of May was 1,741, an increase of 95.8 per cent compared to May of last year and 27.9 per cent above the previous ten-year average of 1,361 listings for May.
Market-wide inventory levels were up 93.8 per cent, with 3.1 months’ supply for all property types at the end of May. The property type that gained the most inventory was the condo apartment segment, which increased by 100 percent. That amounts to 6.0 months’ supply for condo apartments, 2.4 months for detached homes, and 3.6 months for Townhouses. The number of months of inventory represents the amount of time it would take to sell off current inventories at the current sales rate.
The average number of days to sell in May was 16, compared to 14 days in May 2023. The previous 5-year average is 15 days.
Average Sales Price – Municipality

Average Sales Price – Township

Monthly Sales By Property Type

Monthly Supply of Homes for Sale

Monthly Supply of Homes for Sale – By Property Type

Monthly Median Sales Price – By Property Type

Monthly Average Sales Price – By Property Type

Monthly Average Days on Market

If you have any questions at all, are thinking of making a move this summer and wondering what your home might be worth, give me a call or text to 519-497-4646 and we can sit down for a coffee and chat about your family’s needs going forward.
Enjoy the rest of your June and Happy Fathers Day to all the dads out there next weekend!
Kevin
Condo Sales Sluggish but Prices Steady in Waterloo Region for February
I hope you and your family have been enjoying the great weather we have had over the winter. Although the skiers out there probably are not very happy, I personally love the mild weather.
The stats are out for February and sales were pretty sluggish overall but prices are remaining steady due to low inventory levels. Let’s take a look at the numbers….
In February, there were 485 homes sold, representing an increase of 9.7 per cent compared to the previous year and a decline of 19.0 per cent compared to the previous 10-year average for the month.
Home sales remained sluggish in February, up over last year’s record-breaking low, but still well below historical norms for February.
Total residential sales in February included 281 detached (up 9.3 per cent from February 2023), and 110 townhouses (up 10.0 per cent). Sales also included 73 condominium units (up 30.4 per cent) and 24 semi-detached homes (down 14.3 per cent).
In February, the average sale price for all residential properties in Waterloo Region was $755,934. This represents a 0.7 per cent decrease compared to February 2023 and a 0.7 per cent decrease compared to January 2024.
- The average price of a detached home was $889,280. This represents a 0.5 per cent increase from February 2023 and a decrease of 2.2 per cent compared to January 2024.
- The average sale price for a townhouse was $629,734. This represents a 2.2 per cent decrease from February 2023 and a decrease of 1.8 per cent compared to January 2024.
- The average sale price for an apartment-style condominium was $459,455. This represents an increase of 0.2 per cent from February 2023 and an increase of 3.1 per cent compared to January 2024.
- The average sale price for a semi was $673,638. This represents an increase of 1.0 per cent compared to February 2023 and an increase of 4.2 per cent compared to January 2024.
Average Sale Price – Monthly

WRAR cautions that average sale price information can be useful in establishing long-term trends but should not be used as an indicator that specific properties have increased or decreased in value. The MLS® Home Price Index (HPI) provides the best way to gauge price trends because averages are strongly distorted by changes in the mix of sales activity from one month to the next.
| MLS® Home Price Index Benchmark Price | ||||||
| Kitchener-Waterloo | Cambridge | |||||
| Benchmark Type: | February 2024 | Monthly % Change | Yr./Yr. % Change | February 2024 | Monthly % Change | Yr./Yr. % Change |
| Composite | $729,300 | 2.0 | 0.0 | $742,600 | -0.7 | 0.9 |
| Detached | $841,000 | 2.5 | 1.8 | $774,300 | -0.5 | 1.2 |
| Townhouse | $601,200 | 0.6 | 0.8 | $648,500 | -1.6 | 2.2 |
| Apartment | $452,500 | 1.9 | -3.8 | $477,100 | -2.0 | -1.3 |

Examining benchmark and average prices for various property types over the past twelve months reveals a stable housing market in Waterloo Region. With the approaching spring market, both buyers and sellers can take comfort in the steadiness of prices we’ve seen, reinforcing the value of homeownership as a secure and prudent investment in the long run.
There were 800 new listings added last month, an increase of 18.7 per cent compared to February last year and a 6.9 per cent decrease compared to the previous ten-year average for February.
The total number of homes available for sale in active status at the end of February was 943 an increase of 38.9 per cent compared to February of last year and 2.9 per cent below the previous ten-year average of 971 listings for February.
At the end of February, there were 1.7 months of inventory, a 54.5 percent increase compared to last year and 17.2 percent above the previous 10-year average. The number of months of inventory represents how long it would take to sell off current inventories at the current sales rate.
The average number of days to sell in February was 23, compared to 20 days in February 2023. The previous 5-year average was 16 days.
Average Sales Price – Municipality

Average Sales Price – Township

Monthly Sales By Property Type

Monthly Supply of Homes for Sale

Monthly Supply of Homes for Sale – By Property Type

Monthly Median Sales Price – By Property Type

Monthly Average Sales Price – By Property Type

Monthly Average Days on Market

If you have any questions on the stats or are thinking of making a move in the next few months, feel free to give me a call or text to 519-497-4646 or email kevinbakerrealestate@gmail.com and let’s sit down for a coffee and chat about your families needs.
Have a great march break with the kids and a fantastic St Paddy’s day!
Talk soon
Kevin
February Sales Down But Prices Remain Steady
I hope you and your family are enjoying a wonderful weekend and survived the house dumping of snow we received last night. The February Real Estate stats are out for Waterloo region and inventory is tight and sales continue to stay low as prices are remaining steady. Lets take a look at the numbers…
Sales volume set a new low for the month of February, with 439 homes sold, representing a decrease of 45.0 per cent compared to February 2022 and 31.5 per cent below the previous 5-year average for the month.
Once again, we experienced record low listing sales in February, Increased borrowing costs, coupled with a shortage of housing supply and strong demand, have put a strain on prospective buyers as affordability continues to be a top concern; however, home prices have remained stable for the past several months.
Total residential sales in February included 256 detached (down 45.3 per cent from February 2022), and 100 townhouses (down 33.3 per cent). Sales also included 55 condominium units (down 52.6 per cent) and 28 semi-detached homes (down 56.3 per cent).
In February, the average sale price for all residential properties in Waterloo Region was $758,698. This represents a 25.1 per cent decrease compared to February 2022 and a 0.6 per cent decrease compared to January 2023.
- The average price of a detached home was $877,884. This represents a 26.0 per cent decrease from February 2022 and a decrease 0.9 per cent compared to January 2023.
- The average sale price for a townhouse was $642,777. This represents a 25.6 per cent decrease from February 2022 and an increase of 2.7 per cent compared to January 2023.
- The average sale price for an apartment-style condominium was $461,322. This represents a decrease of 19.2 per cent from February 2022 and a decrease of 6.9 per cent compared to January 2023.
- The average sale price for a semi was $667,250. This represents a decrease of 25.8 per cent compared to February 2022 and an increase of 2.6 per cent compared to January 2023.

| MLS® Home Price Index Benchmark Price | ||||||
| Kitchener-Waterloo | Cambridge | |||||
| Benchmark Type: | February 2023 | Monthly % Change | Yr./Yr. % Change | February 2023 | Monthly % Change | Yr./Yr. % Change |
| Composite | $726,500 | 3.0 | -24.2 | $742,300 | 1.6 | -25.3 |
| Detached | $822,800 | 4.2 | -24.8 | $770,800 | 1.8 | -27.0 |
| Townhouse | $588,500 | 0.9 | -22.3 | $637,400 | -0.2 | -13.8 |
| Apartment | $473,800 | -1.6 | -14.3 | $492,100 | 0.9 | -7.6 |

Limited supply and the small number of listings coming to the market continues to be a trend within the region. There may be some hesitation for those considering selling their property due to decreased reported sale prices; however, with demand continuing to outpace supply and prices stabilizing, sellers are in a healthy position to make their move coming into a spring market.
Although prices have fallen more than 20 per cent from their peak in February 2022, they remain significantly higher than three years ago, which is great news for our local market.
There were 671 new listings added last month, a decrease of 37.1 per cent compared to February of last year and a 24.8 per cent decrease compared to the previous ten-year average for February.
The total number of homes available for sale in active status at the end of February was 692, an increase of 75.2 per cent compared to February of last year and 38.0 per cent below the previous ten-year average of 1117 listings for February.
The number of months of inventory is up 140.0 per cent compared to February of last year, but still historically low at 1.2 months. The number of months of inventory represents how long it would take to sell off current inventories at the current sales rate.
The average number of days to sell in February was 20, compared to 8 days in February 2022. The previous 5-year average is 16 days.
Average Sales Price – Municipality

Average Sales Price – Township

Monthly Sales By Property Type

Monthly Supply of Homes for Sale

Monthly Median Sales Price – By Property Type

Monthly Average Sales Price – By Property Type

Monthly Average Days on Market

The Real Estate market is changing very quickly, so If you are thinking of buying or selling this spring, wondering what the neighbor’s place sold for, or have any questions at all, give me a call, text at 519-497-4646 or shoot me an email to kevinbakerrealestate@gmail.com
Enjoy a wonderful March with your families!
Kevin
Condo Prices Cool in November here in Waterloo Region
I hope you and your family are starting to enjoy the holiday season. It’s wonderful that everyone can get together again and make new memories. Let’s hope that the snow stays away just a little longer but arrives just in time for Christmas!
The latest housing stats are out for Waterloo Region, lets take a look at what the numbers have to say…
There were 453 homes sold in November, a decrease of 43.7 per cent compared to November 2021 and 34.2 per cent below the previous 5-year average for the month.
Total residential sales in November included 280 detached (down 38.3 per cent from November 2021), and 78 townhouses (down 57.1 per cent). Sales also included 58 condominium units (down 49.6 per cent) and 37 semi-detached homes (down 28.8 per cent).
As they traditionally do at this time of year, home sales have decreased, at the same time, we know ever-increasing homeownership costs are contributing to the decline and putting downward pressure on sales prices which have plateaued since July.
In November, the average sale price for all residential properties in Waterloo Region was $736,024. This represents a 10.4 per cent decrease compared to November 2021 and a 3.6 per cent decrease compared to October 2022.
- The average price of a detached home was $838,609. This represents a 13.1 per cent decrease from November 2021 and a decrease of 3.5 per cent compared to October 2022.
- The average sale price for a townhouse was $618,669. This represents a 12.3 per cent decrease from November 2021 and a decrease of 2.6 per cent compared to October 2022.
- The average sale price for an apartment-style condominium was $458,384. This represents a decrease of 7.5 per cent from November 2021 and a decrease of 6.2 per cent compared to October 2022.
- The average sale price for a semi was $642,328. This represents a decrease of 9.4 per cent compared to November 2021 and an increase of 3.2 per cent compared to October 2022.

| MLS® Home Price Index Benchmark Price | ||||||
| Kitchener-Waterloo | Cambridge | |||||
| Benchmark Type: | November 2022 | Monthly % Change | Yr./Yr. % Change | November 2022 | Monthly % Change | Yr./Yr. % Change |
| Composite | $711,200 | -1.7 | -12.8 | $744,200 | 1.8 | -10.6 |
| Detached | $791,000 | -2.1 | -14.8 | $770,600 | 2.5 | -12.0 |
| Townhouse | $602,200 | -0.2 | -7.0 | $652,000 | -1.7 | -2.0 |
| Apartment | $492,600 | -0.4 | 8.0 | $504,100 | -3.1 | 3.7 |

The Waterloo Region market has been moving towards more of a balanced market throughout the latter part of the year, and November has followed that trend. We have a long way to go before the pendulum swings into it being a buyer’s market. However, if the Bank of Canada yet again raises its key interest rate on December 7, it is likely to result in fewer buyers competing for more inventory.
There were 752 new listings added last month, a decrease of 6.6 per cent compared to November of last year and a 1.3 per cent increase compared to the previous ten-year average for November.
The total number of homes available for sale in active status at the end of November was 860, an increase of 209.4 per cent compared to November of last year and 29.9 per cent below the previous ten-year average of 1227 listings for November.
The number of months of inventory is up 333.3 per cent compared to November of last year, but still historically low at 1.3 months. Between 2009 and 2015, November’s average months of inventory was 3.2 months. The number of months of inventory represents how long it would take to sell off current inventories at the current sales rate.
The average number of days to sell in November was 21, compared to 10 days in November 2021. The previous 5-year average is 21 days.
Average Sales Price – Municipality

Average Sales Price – Township

Monthly Sales By Property Type

Monthly Supply of Homes for Sale

Monthly Median Sales Price – By Property Type

Monthly Average Sales Price – By Property Type

Monthly Average Days on Market

If you are thinking of buying or selling in the next few months or into to spring of 2023, wondering what the neighbor’s place sold for, or have any questions at all, give me a call, text at 519-497-4646 or shoot me an email to kevinbakerrealestate@gmail.com
Enjoy a wonderful holiday season with your family and friends!
Kevin
Home Sales Slow in Kitchener Waterloo and Cambridge
I hope you and your family enjoyed a great Halloween. Even with the rain I heard there were plenty of little ones out having fun! Fall is certainly here and the leave piles are growing although we really can’t complain about the weather, its been so nice out lately.
The latest housing stats are out for Waterloo Region, lets take a look at what the numbers have to say…
There were 491 residential homes were sold last month, a decrease of 39.7 per cent compared to October 2021 and 36.2 per cent below the previous 5-year average for the month.
Total residential sales in October included 310 detached (down 38.2 per cent from October 2021), and 84 townhouses (down 45.1 per cent). Sales also included 64 condominium units (down 36.0 per cent) and 31 semi-detached homes (down 47.5 per cent).
The pace of home sales continued to slow in October after the Bank of Canada’s sixth straight interest rate hike in September. Faced with higher borrowing costs, some buyers have had to re-assess what they can afford. As these buyers get moved to the sidelines, sellers question if now is the best possible time to sell.
In October, the average sale price for all residential properties in Waterloo Region was $763,630. This represents an 8.4 per cent decrease compared to October 2021 and a 1.6 per cent increase compared to September 2022.
- The average price of a detached home was $860,568. This represents a 10.6 per cent decrease from October 2021 and a decrease of 0.3 per cent compared to September 2022.
- The average sale price for a townhouse was $635,197. This represents a 9.0 per cent decrease from October 2021 and a decrease of 0.4 per cent compared to September 2022.
- The average sale price for an apartment-style condominium was $488,277. This represents an increase of 3.9 per cent from October 2021 and an increase of 7.3 per cent compared to September 2022.
- The average sale price for a semi was $624,999. This represents a decrease of 10.8 per cent compared to October 2021 and a decrease of 1.9 per cent compared to September 2022.

| MLS® Home Price Index Benchmark Price | ||||||
| Kitchener-Waterloo | Cambridge | |||||
| Benchmark Type: | October 2022 | Monthly % Change | Yr./Yr. % Change | October 2022 | Monthly % Change | Yr./Yr. % Change |
| Composite | $723,200 | -0.2 | -8.8 | $730,700 | -2.3 | -9.8 |
| Detached | $807,900 | -0.0 | -10.1 | $751,800 | -2.1 | -11.6 |
| Townhouse | $603,700 | -1.3 | -3.2 | $663,100 | -2.4 | 1.8 |
| Apartment | $494,400 | -0.1 | 6.5 | $520,100 | -6.6 | 7.3 |

While there is uncertainty in the minds of consumers about current market conditions, one thing is for certain, Waterloo region’s housing supply remains one of the tightest in the country. Buyers may be on the sidelines for now due to affordability, but the underlying demand for housing remains strong.
There were 827 new listings added last month, a decrease of 3.3 per cent compared to October of last year and a 14.3 per cent decrease compared to the previous ten-year average for October.
The total number of homes available for sale in active status at the end of October was 928, an increase of 134.9 per cent compared to October of last year and 34.9 per cent below the previous ten-year average of 1425 listings for October.
The number of months of inventory is up 160.0 per cent compared to October of last year, but still historically low at 1.3 months. Between 2009 and 2015, October’s average months of inventory was 3.6 months. The number of months of inventory represents how long it would take to sell off current inventories at the current sales rate.
The average number of days to sell in October was 22, compared to 10 days in October 2021. The previous 5-year average is 19 days.
Average Sales Price – Municipality

Average Sales Price – Township

Monthly Sales By Property Type

Monthly Supply of Homes for Sale

Monthly Median Sales Price – By Property Type

Monthly Average Sales Price – By Property Type

If you are thinking of buying or selling this fall, wondering what the neighbor’s place sold for, or have any questions at all, give me a call, text at 519-497-4646 or shoot me an email to kevinbakerrealestate@gmail.com
Enjoy the great weather while its here!
Kevin
Home Sales Decline but Prices steady in Waterloo Region Real Estate
Happy Thanksgiving! I hope you and your family are able to spend a wonderful holiday together. The weather looks great for the rest of weekend and with the leaves starting to turn fall is certainly here.
The stats are out for September and sales were down considerably over last year and the 5 year average, but prices are starting to hold these levels and have been relatively flat the last 2 months.
There were 518 residential homes were sold last month, a decrease of 25.3 per cent compared to September 2021 and 30.8 per cent below the previous 5-year average for the month.
Total residential sales in September included 313 detached (down 18.9 per cent from September 2021), and 94 townhouses (down 39.0 per cent). Sales also included 60 condominium units (down 37.5 per cent) and 51 semi-detached homes (down 8.9 per cent).
Interest rate hikes have continued to put pressure on the housing market as a whole. The property type that saw the biggest decline in sales was the townhouse segment followed closely by condos, which could indicate there are fewer entry-level buyers in the market due to the higher borrowing costs.
In September, the average sale price for all residential properties in Waterloo Region was $752,421. This represents a 4.7 per cent decrease compared to September 2021 and a 0.1 per cent increase compared to August 2022.
- The average price of a detached home was $862,435. This represents a 7.4 per cent decrease from September 2021 and an increase of 1.3 per cent compared to August 2022.
- The average sale price for a townhouse was $638,284. This represents a 2.7 per cent decrease from September 2021 and an increase of 4.4 per cent compared to August 2022.
- The average sale price for an apartment-style condominium was $455,262. This represents a decrease of 8.5 per cent from September 2021 and a decrease of 2.3 per cent compared to August 2022.
- The average sale price for a semi was $637,205. This represents a decrease of 6.5 per cent compared to September 2021 and a decrease of 2.8 per cent compared to August 2022.

| MLS® Home Price Index Benchmark Price | ||||||
| Kitchener-Waterloo | Cambridge | |||||
| Benchmark Type: | September 2022 | Monthly % Change | Yr./Yr. % Change | September 2022 | Monthly % Change | Yr./Yr. % Change |
| Composite | $724,600 | -1.3 | -6.7 | $748,000 | -0.4 | -3.7 |
| Detached | $807,700 | -0.9 | -8.4 | $768,100 | 0.4 | -5.3 |
| Townhouse | $611,600 | -1.1 | 1.8 | $679,300 | -5.0 | 5.8 |
| Apartment | $493,800 | -3.9 | 9.7 | $556,600 | -3.8 | 16.5 |

While sales were down last month, we seem to be moving towards a more balanced market; buyers now have more inventory to choose from, yet sellers can still expect their properties to sell within a reasonable timeframe. We’re also observing that sale prices are shifting closer to the asking price. Furthermore, the sales-to-new listings ratio of 56.4 per cent in September compared to 70.8 per cent in August. (According to CMHC, a sales-to-new-listings ratio above 55 per cent is associated with a sellers’ market, while an overheating market corresponds to the upper range of a sellers’ market, with a ratio exceeding 70 per cent).
There were 918 new listings added last month, a decrease of 3.6 per cent compared to September of last year and a 15.9 per cent decrease compared to the previous ten-year average for September.
The total number of homes available for sale in active status at the end of September was 978, an increase of 108.5 per cent compared to September of last year and 35.4 per cent below the previous ten-year average of 1515 listings for September.
The number of months of inventory is up 180.0 per cent compared to September of last year, but still historically low at 1.4 months. Between 2009 and 2015, the average number of months of inventory for September was 3.7 months. The number of months of inventory represents how long it would take to sell off current inventories at the current sales rate.
The average number of days to sell in September was 23, compared to 10 days in September 2021. The previous 5-year average is 20 days. Average Sales Price – Municipalit

Average Sales Price – Township

Monthly Sales By Property Type

Monthly Supply of Homes for Sale

Monthly Median Sales Price – By Property Type

Monthly Average Sales Price – By Property Type

Monthly Average Days on Market

If you are thinking of buying or selling this fall, wondering what the neighbor’s place sold for, or have any questions at all, give me a call, text at 519-497-4646 or shoot me an email to kevinbakerrealestate@gmail.com
Enjoy the fall colors and have a wonderful Thanksgiving with your family.
Kevin
March Condo Sales up but prices dip for Kitchener Waterloo Real Estate
I hope you and your family are doing well. Looks like spring is here and Easter is just around the corner. The March stats are out and home sales are up over February, but prices have taken a small dip from the february average as well. Lets take a look at the numbers…
There were 725 residential homes sold in March 2022 is a decrease of 27.1 per cent compared to March 2021, which continues to hold the record for most home sales in a single month. On a month-over-month basis, sales in March were up 19.4 per cent compared to February 2022. The previous ten-year average number of residential sales for March is 599.
The skyrocketing prices of the last two months took a bit of a breather in March, with the overall average price dipping five per cent compared to what we saw in February. While it is too soon to draw conclusions from just one month of home sales, I know many will be comforted to see a leveling off on the average price, no matter how incremental.
Total residential sales in March included 416 detached (down 29.7 per cent from March 2021), and 114 condominium units (down 9.5 per cent). Sales also included 64 semi-detached homes (down 17.9 per cent) and 131 townhouses (down 33.8 per cent).
In March, the average sale price for all residential properties in the Kitchener-Waterloo area was $960,181. This represents a 25.5 per cent increase over March 2021 and a 4.6 per cent decrease compared to February 2022.
- The average price of a detached home was $1,132,637. This represents a 25.9 per cent increase from March 2021 and a decrease 6.4 per cent compared to February 2022.

The MLS® HPI composite benchmark price for all residential properties in Kitchener-Waterloo was $960,100 in March. This represents a 29.6 per cent increase over March 2021 and a 1.5 per cent decrease compared to February 2022.
- The benchmark price for a detached home was $1,046,200. This represents a 28.1 per cent increase from March 2021 and 4.0 per cent decrease compared to February 2022.

Even though the average price decreased across all property types on a month-to-month basis, the MLS® HPI showed continued monthly gains for both townhouse and apartment property types. As the province feels its way out of the pandemic, we are beginning to see some very preliminary signs of a potential cooling. We are not seeing quite as many multiple offers and some offers are coming in with conditions. Of course, when we say cooling, we’re talking about a market that has been scorching hot which is why we are pleased to see this happening.
There were 1,131 new listings added last month, a decrease 16.8 per cent compared to the record topping number of listings added in March of last year, and a 28.0 per cent increase compared to the previous ten-year average for March.
The total number of homes available for sale in active status at the end of March was 441, an increase of 1.1 per cent compared to March of last year, and 59.0 per cent below the previous ten-year average of 1,072 listings for March.
The number of months of inventory nudged up to 0.7 months in March from 0.5 months in February. Inventory has been under the one-month mark since October 2020. The number of months of inventory represents how long it would take to sell off current inventories at the current rate of sales.
The average number of days to sell in March was 8 days, the same as it was in March 2021. The previous 5-year average is 16 days.
Historical Sales By Property Type

Months Supply of Homes for Sale

Historical Median Sales Price – By Property Type

Historical Average Sales Price – By Property Type


If you are thinking of buying or selling this spring, wondering what the neighbor’s place sold for, or have any questions at all, give me a call, text at 519-497-4646 or shoot me an email to kevinbakerrealestate@gmail.com
Enjoy the nicer weather and have a wonderful Easter with your family!
Kevin
Condo sales continue to hum along in waterloo region
Hope you and your family are enjoing your summer. The weather this weekend has been beautiful so i hope you have been able to get out and enjoy it.
The Real estate market here in Waterloo region continues to show incredible strength with low invetory and strong demand which is keeping prices humming in July.
The was a total of 611 residential homes sold last month, a decrease of 17 per cent compared to the record-setting results of July 2020, but still an above-average number of sales for the month of July.
Total residential sales in July included 339 detached (down 27.1 per cent from July 2020), and 91 condominium units (up 30 per cent). Sales also included 46 semi-detached homes (down 4.2) and 135 townhouses (down 11.8 per cent).
In July, the average sale price for all residential properties in the Kitchener-Waterloo area was $755,681. This represents a 18.2 per cent increase over July 2020 and a 0.6 per cent decrease compared to June 2021.
- The average price of a detached home was $907,192. This represents a 21.9 per cent increase from July 2020 and a decrease of 1.4 per cent compared to June 2021.
- The average sale price for an apartment-style condominium was $429,630. This represents an increase of 6.7 per cent from July 2020 and a decrease of 3.6 per cent compared to June 2021.
- The average sale price for a townhouse was $623,732. This represents a 33.8 per cent increase from July 2020 and an increase of 5.4 per cent compared to June 2021.
- The average sale price for a semi was $667,570. This represents an increase of 28.6 per cent compared to July 2020 and an increase of 2.9 per cent compared to June 2021.

The MLS® HPI composite benchmark price for all residential properties in Kitchener-Waterloo was $748,700 in July. This represents a 30.5 per cent increase over July 2020 and a 0.4 per cent increase compared to June 2021.
- The benchmark price for a detached home was $822,300. This represents a 31.1 per cent increase from July 2020 and 0.2 per cent increase compared to June 2021.
- The benchmark price for an apartment-style condominium was $385,900. This represents a 19.5 per cent increase from July 2020 and a 3.3 per cent increase compared to June 2021.
- The benchmark price for a townhouse is $564,500. This represents a 40 per cent increase from July 2020 and a 0.4 per cent decrease compared to June 2021.

The housing market took a bit of a breather last month and July is typically a quieter month with families taking vacation, and with the region coming out of lockdown there were certainly more staycations happening. But we do anticipate the market will pick up steam again and it will be another busy fall.
There were 675 new listings added to the MLS® System in KW and area last month, a decrease of 24 per cent compared to July of last year, and a 14.4 per cent decrease compared to the previous ten-year average for July.
The total number of homes available for sale in active status at the end of July was 281, a decrease of 52.7 per cent compared to July of last year, and 79.1 per cent below the previous ten-year average of 1,346 listings for July.
The number of months of inventory was 0.4 in July, a decline from 0.5 months in June. Inventory has numbered less than 1 month since October. The number of months of inventory represents how long it would take to sell off current inventories at the current rate of sales.
The average number of days to sell in July was 11 days, compared to 17 days in July 2020 and a previous 5-year average of 22 days.
Historical Sales By Property Type

Months Supply of Homes for Sale

Historical Median Sales Price – By Property Type

Historical Average Sales Price – By Property Type


If you are thinking of buying or selling in the coming months, wonder what the neighbor sold for, or have any questions at all, give me a call, text at 519-497-4646 or shoot me an email to kevinbaker@kwhometeam.ca.
Have a wonderful rest of the weekend and stay safe!
Kevin
